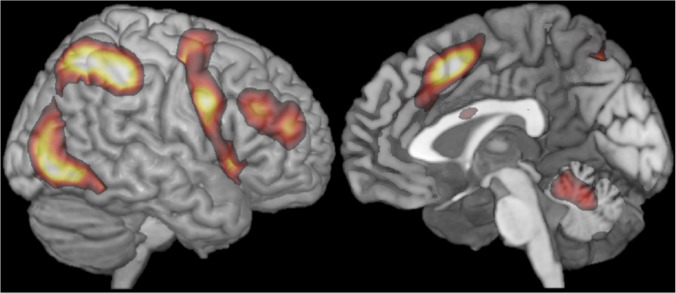
Fig. 2.
A group-level representation of the MD activity based on average activity in left and right hemispheres. To create this representation, we (i) reflected left hemisphere data to the right, (ii) averaged the resulting 14 (7 contrasts × 2 hemispheres) t-maps, and (iii) thresholded the map at t = 1.5. The map (including a parcellated version) can be downloaded at http://imaging.mrc-cbu.cam.ac.uk/imaging/MDsystem.

