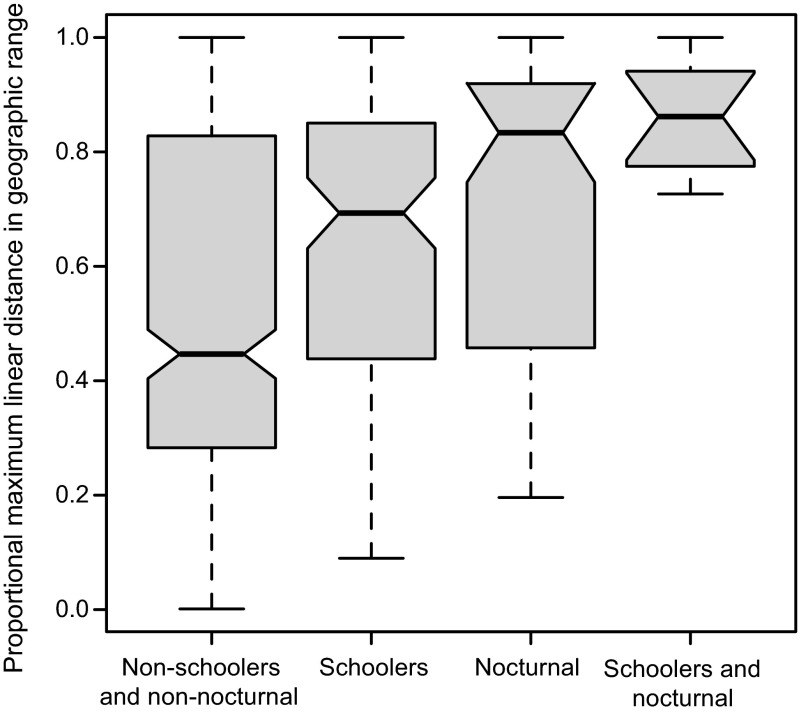
Fig. 2.
Effects of schooling behavior and nocturnal activity on the ratio between the range size of species and the extent of the region. Dashed vertical lines, gray bars, and black horizontal lines represent, respectively, data range, interquartile range, and median. Nonoverlapping notches among the gray bars signify a difference at the 95% confidence level.

