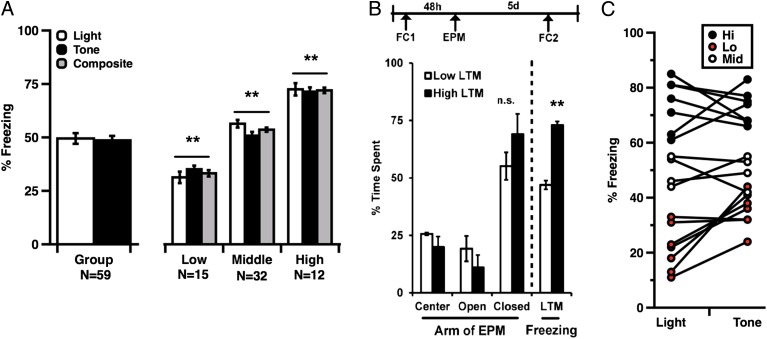
Fig. 3.
(A) Group means, tone, light, and composite LTM scores from phenotypically stable rats. All phenotypic groups differed significantly from each other (ANOVA, phenotype: F(1,56) = 187.75; P < 0.001; post hoc: Low vs. Middle: t (23) = 7.89, P < 0.001; Low vs. High: t (23) = 10.69, P < 0.001; High vs. Middle, t = 4.152: P < 0.001, Bonferroni). (B) Stable differences in memory expression did not significantly correlate with anxiety on the elevated plus maze (H-LTM vs. L--LTM, closed arm time, t test, P > 0.05). (C) H-LTM and L-LTM rats selected for biochemical analysis showed stable performance on tone and light memory tests. Error bars indicate ± SEM; **P < 0.001.

