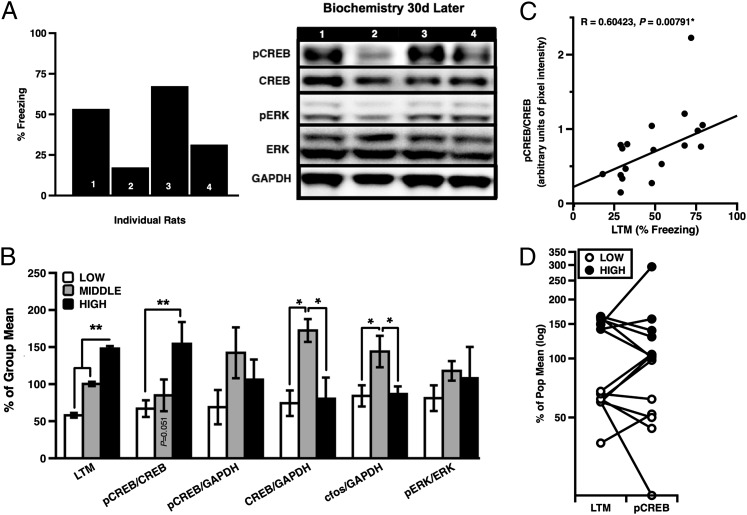
Fig. 4.
(A) A series of Western blots assessing pCREB, CREB, pERK, ERK, and GAPDH from individual rats; (B) Group biochemical measures in LA tissue from L-LTM and H-LTM rats 30 d after memory test (ANOVA, phenotype: F(2,15) = 5.325, P = 0.018, post hoc: High vs. Low, P = 0.016, Tukey HSD; CREB: F(2,15) = 4.793, P = 0.025; c-fos F(2,14) = 5.323, P = 0.019; post hoc (CREB): Middle vs. Low, P = 0.026; Middle vs. High, P = 0.049, Tukey HSD; post hoc (c-fos): Middle vs. Low, P = 0.020; Middle vs. High, P = 0.043, Tukey HSD). (C) Basal pCREB/CREB significantly correlated with memory (n = 18, R = 0.604, P = 0.007). (D) LTM performance was a relatively good predictor of pCREB/CREB levels. Error bars indicate ± SEM; *P < 0.05; **P < 0.001.

