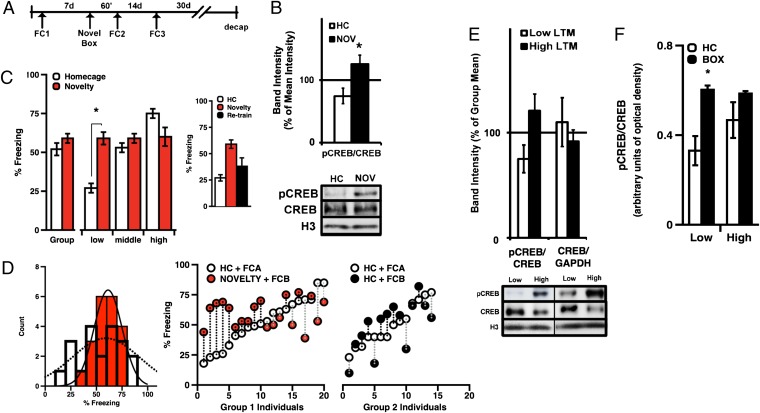
Fig. 5.
(A) Protocol used for novelty experiments. (B) Relative to total CREB, novelty increased LA pCREB 1 h later [n = 5/4; t test, t (7) = −3.028, P = 0.019]. (C) Novelty enhanced L-LTM performance when training occurred 1 h [t test, t (5) = 5.55, P = 0.003], but not 2 wk, later (t test, planned comparison: L-LTM in s1 vs. s3, P > 0.05). (D) Pretraining novelty significantly reduced variance in LTM scores (n = 20; F = 3.20, P = 0.015). (E) Thirty days after LTM test, L-LTM rats expressed lower baseline pCREB than H-LTM rats [t test, t (9) = 2.14, P = 0.061]. (F) L-LTM (n = 5) but not H-LTM (n = 6) rats express significantly higher pCREB 1 h after novelty (ANOVA, novelty: F(2,19) = 9.165, P = 0.007; interaction: F(1,19) = 4.916, P = 0.039, post hoc: L-LTM + novelty (n = 5): t(4.6) = 4.014, P = 0.012). Representative Western blots depict independent measures of CREB, pCREB, and histone H3 protein levels. Error bars indicate ±SEM; *P < 0.05.

