
Fig. 1.

Positional information carried by the expression of Hb. (A) Optical section through the midsagittal plane of a Drosophila embryo with immunofluorescence staining against Hb protein. (Scale bar =  .) (B) Normalized dorsal profiles of fluorescence intensity, which we identify as Hb expression level g, from 24 embryos (light red dots) selected in a 38- to 48-min time interval after the beginning of nuclear cycle 14. Position x along the anterior/posterior axis is normalized by the length L of the embryo;
  corresponds to the anterior end of the embryo, and
  corresponds to the posterior end. Means
  and SDs
  are plotted in darker red. Considering all points with g = 0.1, 0.5, or 0.9 (Left), yields the conditional distributions with probability densities
  (Right). Note that these distributions are much more sharply concentrated than the uniform distribution
  shown in light gray; correspondingly, the entropies
  are very much smaller than the entropy
  . For each g, we note the reduction of uncertainty in x by reading out g,
 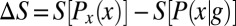 . (C) Variations in expression level around the mean at each position, estimated by the distribution of normalized relative expression, given by
 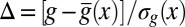 (red circles with SEMs). The solid line is a zero mean/unit variance Gaussian.