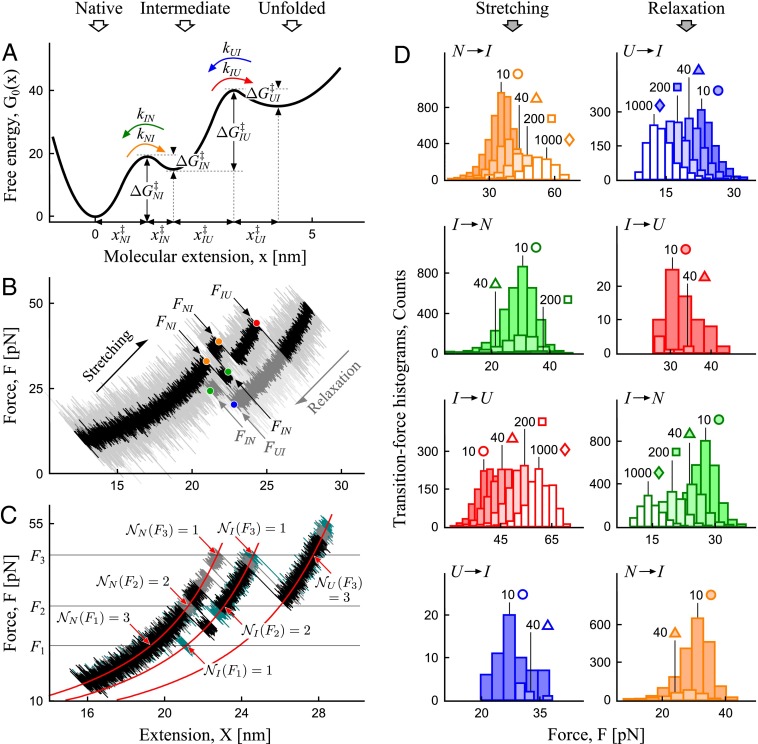
Fig. 3.
Practical implementation of the transformation in Eqs. 2 and 3, illustrated with conformational dynamics through an intermediate. Color code distinguishes different types of transitions. (A) Free-energy profile at zero force, featuring an intermediate. Indicated are the parameters of the barriers and intrinsic rates sought to be reconstructed. (B) Selected force–extension trajectories from a stretching and relaxation cycle, generated on the potential in A in the presence of an anharmonic linker and a pulling device with the spring constant ϰ = 5 pN/nm, representative of an atomic force microscope. Transition forces for different types of transitions are indicated. (C) Determining  in Eq. 2 and “trajectories in state i at F” in Eq. 3 by counting trajectories in the state of interest at a chosen value of force, illustrated with three trajectories from a stretching cycle. (D) Transition force histograms collected from the force–extension curves at the nominal loading rates indicated (in piconewtons per second) next to each histogram. As the result of the transformation (Eqs. 2 and 3), each histogram contributes to the corresponding branch on the rate map (Fig. 4A) as indicated by the matching symbol next to the histogram.

