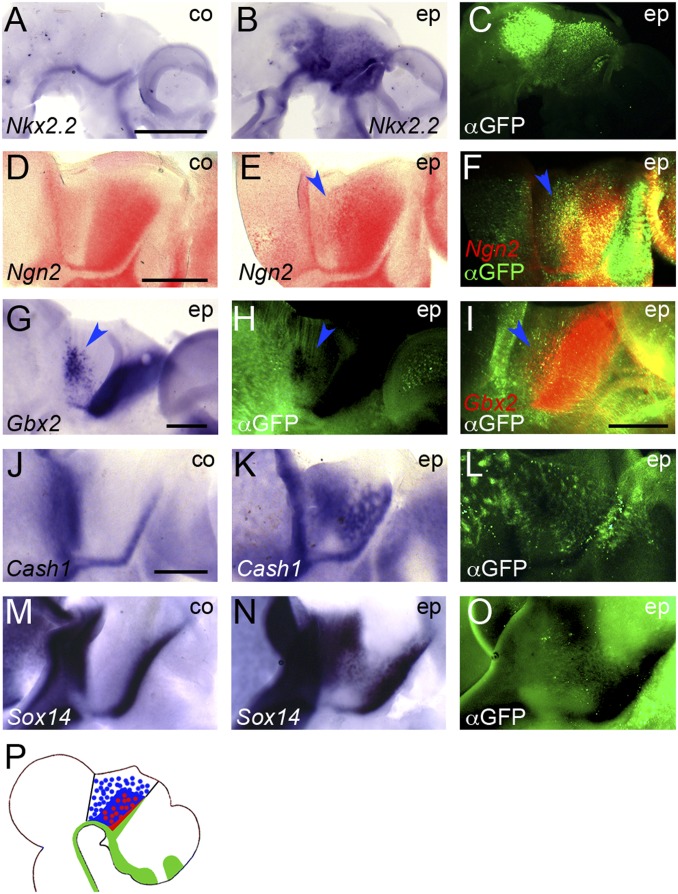
Fig. 2.
Ectopic activation of Shh signaling results in ectopic induction of thalamic markers between the FMB and ZLI. (A–O) Lateral views of hemisected chick brains electroporated (ep) with SmoM2 between E2.5 and E3 and fixed 1 dpe (A–C), 2 dpe (D–F), or 3 dpe (G–O). Anterior points to the right. A, D, J, and M are unelectroporated control halves (co). ISH for Nkx2.2 (A and B), Ngn2 (D–F), Gbx2 (G and I), Cash1 (J and K), and Sox14 (M and N). D–F and I were developed using Fast Red substrate; all others were stained using NBT/BCIP. C, H, L, and O show anti-GFP immunofluorescence (αGFP); F and I show overlay of anti-GFP immunofluorescence and Fast Red fluorescence. [Scale bars in A (for A–C), D (for D–F), I, and J (for J–O), 1 mm; scale bar in G (for G and H) 0.5 mm.] Blue arrowheads point to areas of ectopic induction of Ngn2 (E and F), Gbx2 (G and I), and quenched GFP signal in ectopic Gbx2 area (H). (P) Schematic representation of ectopic induction of rTh (red) and cTh (blue) markers after SmoM2 electroporation.

