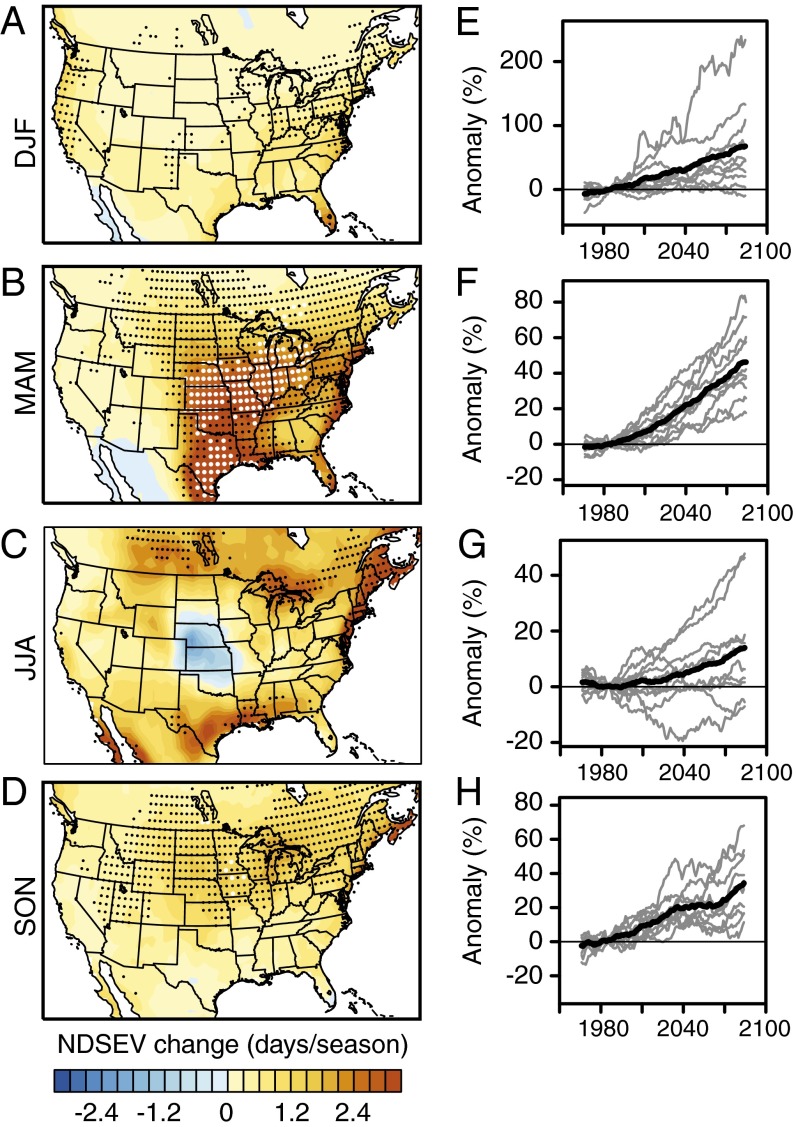
Fig. 1.
Response of severe thunderstorm environments in the late 21st century period of RCP8.5 during the winter (DJF), spring (MAM), summer (JJA), and autumn (SON) seasons. (A–D) Color contours show the difference in the number of days on which severe thunderstorm environments occur (NDSEV) between the 2070–2099 period of RCP8.5 and the 1970–1999 baseline, calculated as 2070–2099 minus 1970–1999. Black (gray) dots identify areas where the ensemble signal exceeds one (two) SD(s) of the ensemble noise, which we refer to as robust (highly robust). (E–H) Each gray line shows an individual model realization. For each realization, the anomaly in the regional average NDSEV value over the eastern United States (105–67.5°W, 25–50°N; land points only) is calculated for each year in the 21st century, with the anomaly expressed as a percentage of the 1970–1999 baseline mean value. A 31-y running mean then is applied to each time series of percentage anomalies. The black line shows the mean of the individual realizations.

