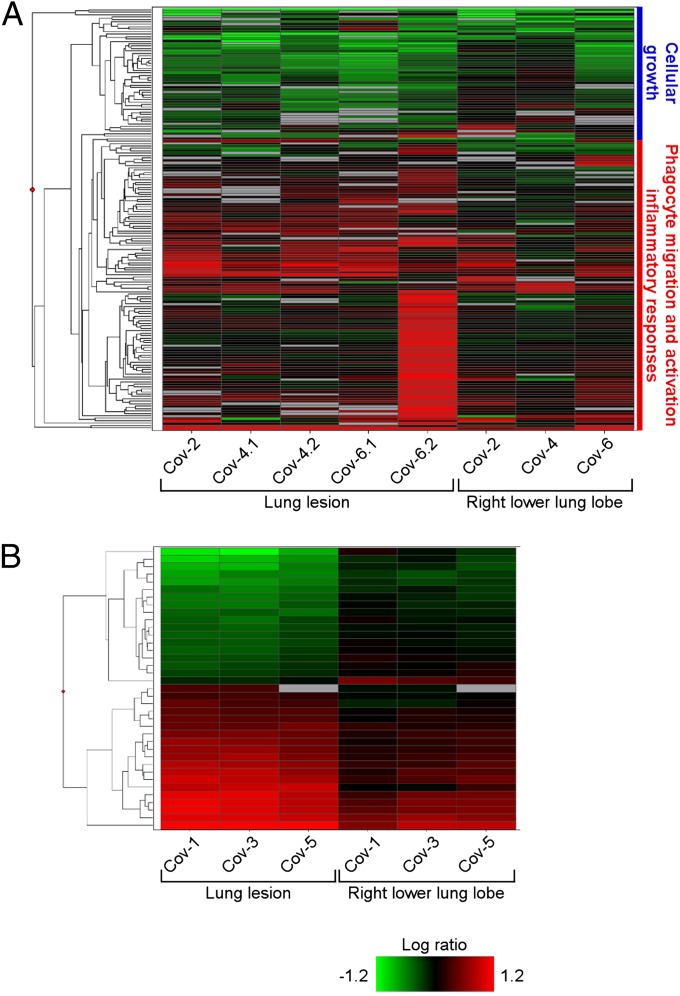
Fig. 7.
Microarray analysis of gene expression in lungs of rhesus macaques inoculated with MERS-CoV. The heatmap shows log10 ratios to uninfected controls of differentially expressed genes in the right lung lower lobe and lung lesion samples as determined by Welch’s t test (P < 0.01, fold-change ≥ 2), and grouped by hierarchical clustering. A representation is shown of 173 differentially expressed genes from individual animals and sample sites at 3 dpi (A) and of 37 differentially expressed genes from individual animals and sample sites at 6 dpi (B). Functional analysis was performed on subgroups of the day 3 differentially expressed genes, and enriched functional categories identified by IPA are shown in the blue and red vertical bars to the right of the heatmap in A. Differentially expressed genes are specified in Table S2 (3 dpi) and Table S3 (6 dpi).

