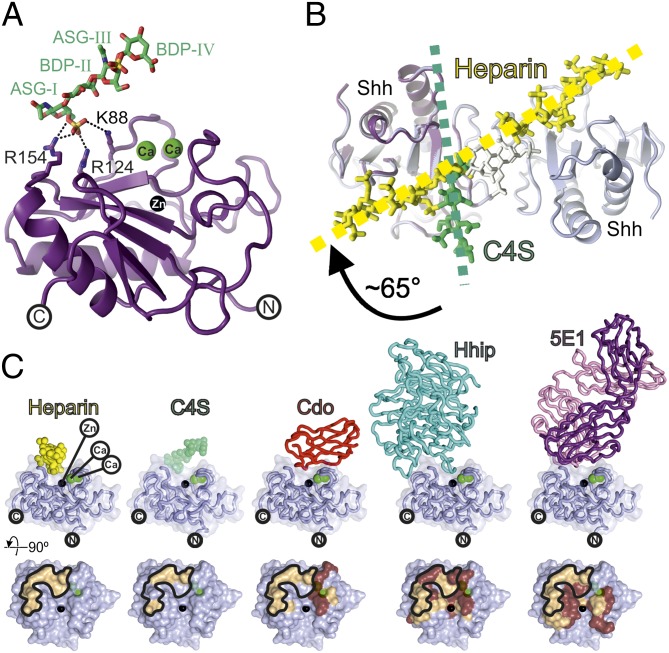
Fig. 2.
Structure of the Shh–C4S complex and analysis of the ShhN core GAG-binding site. (A) Ribbon representation of the ShhNΔ39–C4S complex [Shh, violet; calciums, green; zinc, black; C4S, atomic coloring (green, carbon; red, oxygen; blue, nitrogen; orange, sulfur)]. (B) Comparison of the Shh–C4S and Shh–heparin structures. View is as in Fig. 1C. The Shh–C4S complex is superimposed onto the Shh–heparin complex (Shh, light blue; heparin, yellow). Directions of the GAG chains are shown. (C, Upper) Ribbon representation of Shh (light blue) complexes with (from Left to Right) heparin, C4S, Cdo [Protein Data Bank (PDB) ID 3D1M], Hhip (PDB ID 2WFX), and the antigen-binding fragment of the antibody 5E1 (PDB ID 3MXW). (Lower) Binding footprints mapped on Shh corresponding to Upper. Hydrophilic interactions, beige; hydrophobic interactions, brown. The heparin binding footprint on Shh is marked.

