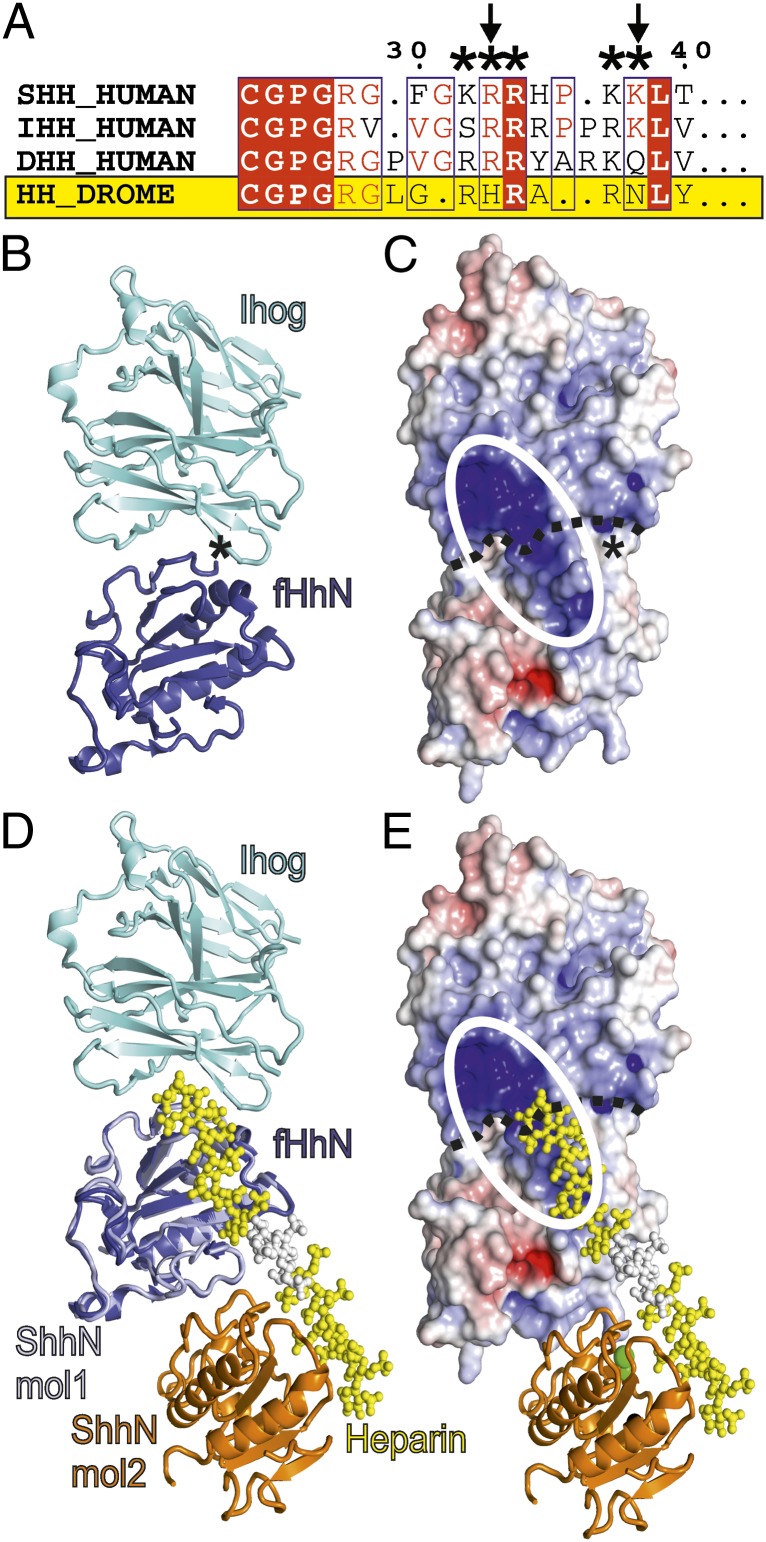
Fig. 3.
Implications of the Shh–GAG-binding site for fly Hh signaling. (A) Sequence alignment of the Shh CW. The CW is marked (*) and is only partially conserved in fly (residue exchanges are indicated with arrows). DROME, Drosophila melanogaster. (B–E) Comparison of the core GAG-binding site in mouse and fly. (B and C) The fHh–Ihog complex (PDB ID 2IBG) (fHh, blue; Ihog, cyan). In C, the surface is color coded according to electrostatic potential from red (−8 kbT/ec) to blue (+8 kbT/ec). The continuous basic surface stretch formed by both fHh and Ihog is marked as a white ellipse. The asterisk marks the fHh N terminus. (D and E) Superposition of the ShhNΔ39–heparin complex onto fHh (Shh, lightblue/orange; heparin, yellow/white) in the same orientation as in B and C. Extension of the heparin chain would result in covering the positively charged patch on Ihog.

