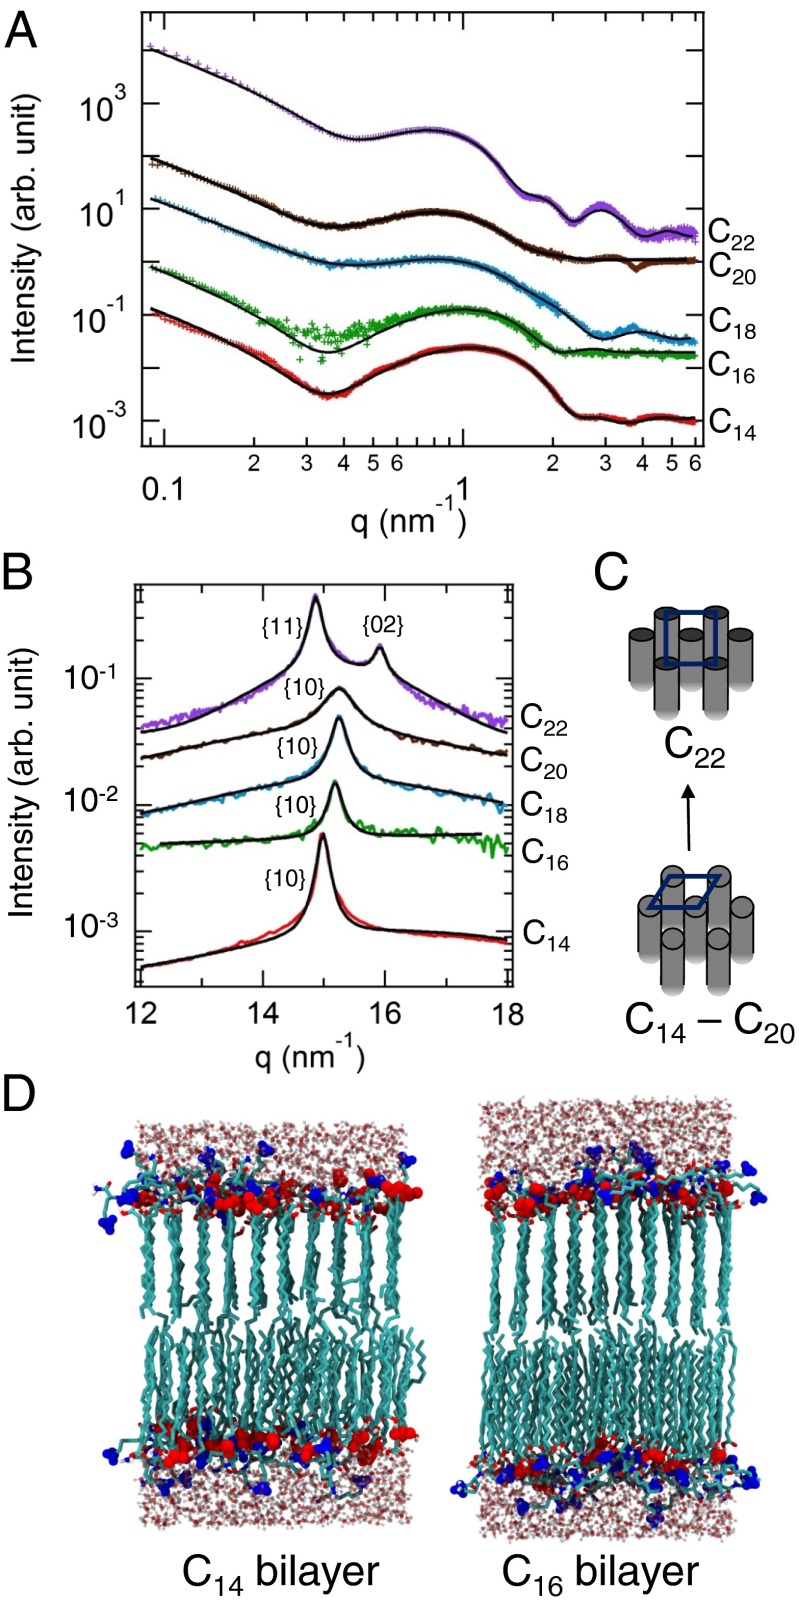
Fig. 3.
(A) In situ SAXS and (B) WAXS data showing the background-subtracted scattered intensity versus the scattering vector q for mixtures of catanionic amphiphiles as the tail length n is increased from 14 to 22. The datasets are offset vertically for clarity. The black lines are the fits. (C) Schematic representations showing changes in molecular packing with tail length. (D) Snapshots of the atomistic MD simulations on C14 and C16 systems. Carbon atoms are colored cyan; the headgroups of the charged amphiphiles are highlighted in blue for NH3+ or red for COO–. Water molecules are shown explicitly.

