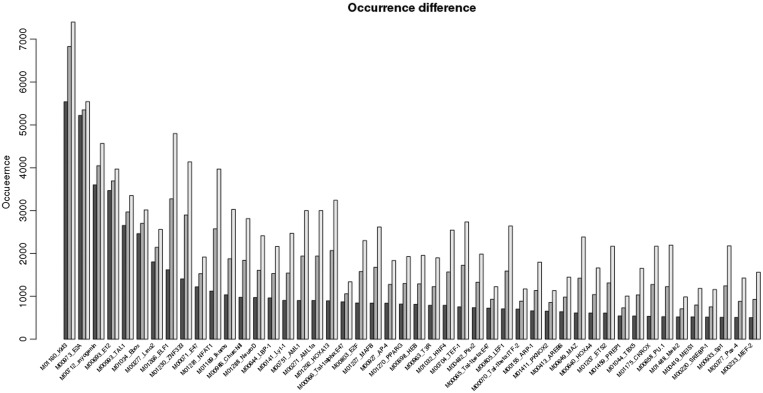
Figure 2.
Distribution of factors around MyoD. The variation in occurrence of 48 factors in combination with MyoD in varied window. Figure shows the differences in occurrence of 48 factors in combination with MyoD in varied window size 200 bp (black bar), 500 bp (dark gray bar) and 1000 bp (light gray bar). The occurrences are shown in the y-axis. These 48 factor’s occurrences are found to be significant (z-score >3 comparing with a background), and they are found in >500 promoters when analyzed with window size 100 bp.

