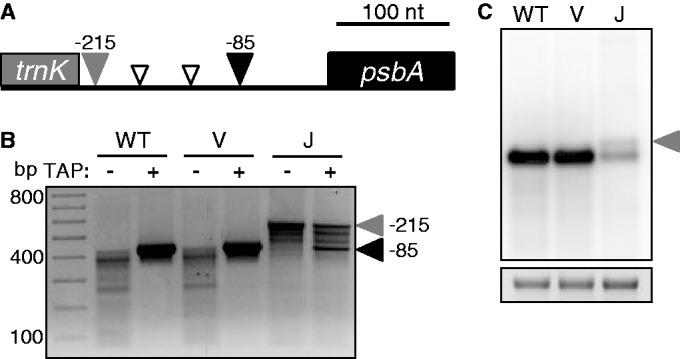
Figure 5.

psbA 5′ end analysis. (A) Schematic of major psbA 5′ RACE products. The gray rectangle represents the 3′ end of trnK exon 2. The filled gray and black arrowheads correspond to the 5′ ends marked in (B). Open arrowheads represent 5′ ends of estimated sizes. (B) 5′ RACE products for psbA. Primary transcript initiating at the PEP promoter (filled black arrowhead) (34); read-through transcript from the upstream trnK gene (filled gray arrowhead). Positions shown are relative to the psbA translation initiation codon. (C) Strand-specific RNA gel blot analysis of psbA. The filled gray arrowhead designates psbA transcripts arising as byproducts of trnK 3′ end maturation. An ethidium bromide-stained image of 28S rRNA is shown below to represent loading.
