Figure 4.
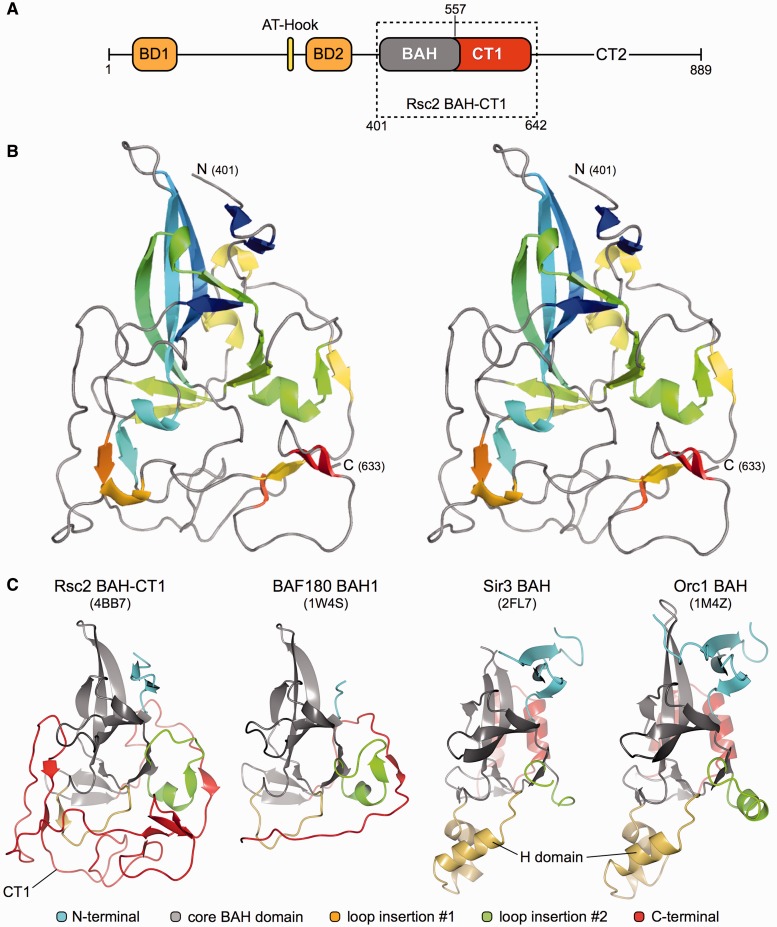
Structure of the Rsc2 BAH-CT1. (A) Schematic representation of the functional domains of Saccharomyces cerevisiae Rsc2 where BD, BAH and CT indicate bromodomain, BAH domain and C-terminal conserved regions, respectively. The boxed region indicates the amino acid boundaries of the RSC2-BAH-CT1 expression construct used in this study. (B) Stereo-pair secondary structure cartoon of RSC2-BAH-CT1, colored blue to red from the visible N-terminus at residue 401 to the C-terminus at residue 633. (C) Side-by-side comparison of the BAH domain structures of Rsc2 BAH-CT1 (this study), BAF180, Sir3 and Orc1. The core canonical BAH domain fold is colored gray in each case. N- and C-terminal additions/extensions to the fold are colored blue and red, respectively, with loop insertions at two points colored in green and yellow. PDB accession codes are shown in parentheses.

