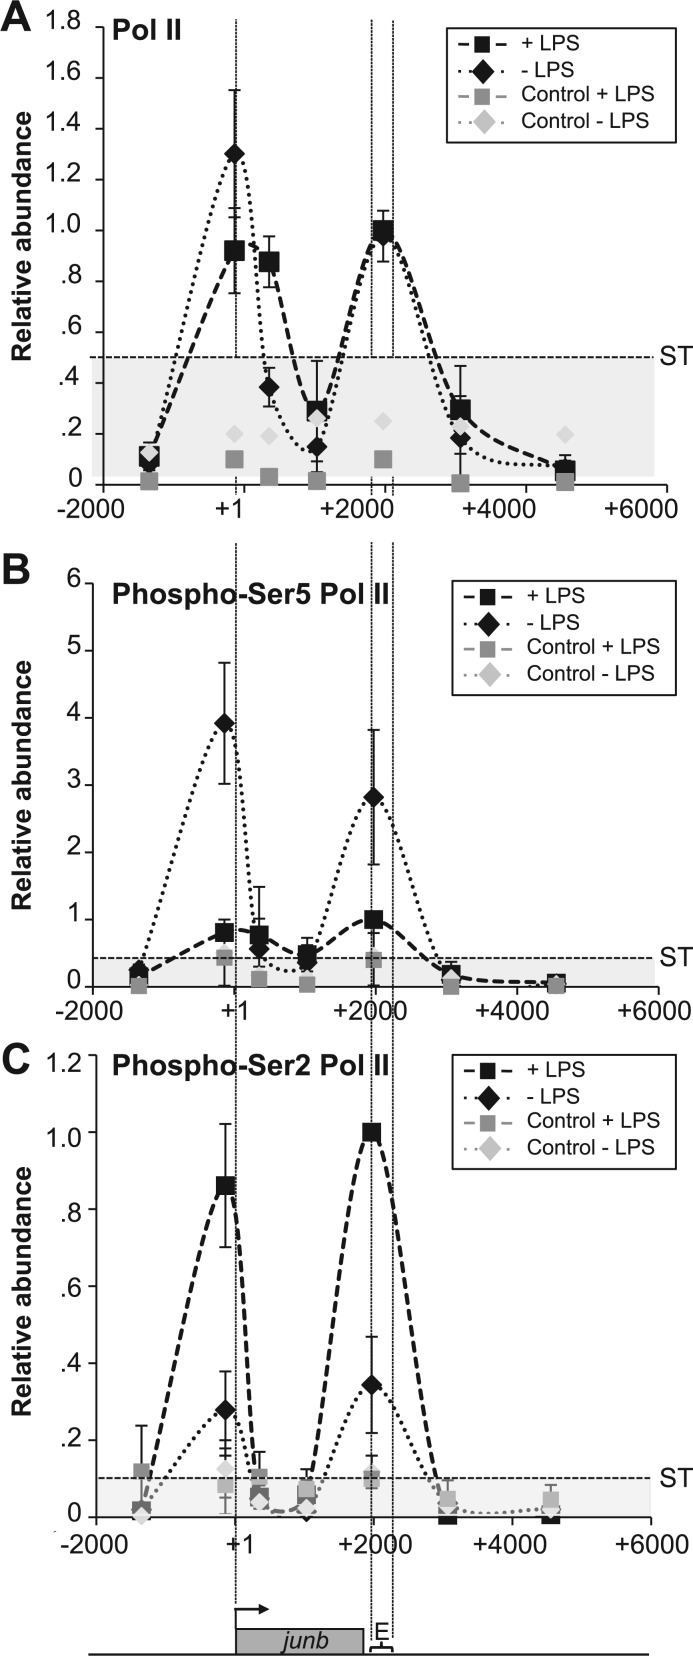
Figure 4.
Pol II distribution and modifications on the junb locus. (A) Distribution of Pol II. DC2.4 cells were stimulated, or not, by LPS and ChIP experiments were conducted with a specific anti-Pol II antiserum. ChIP procedures, controls and quantification of relative abundances were the same as in Figure 3. The presented values are those obtained at the peak of LPS induction. The data are the means of three independent experiments ± SD. ST was 0.45. (B) Distribution of phospho-Ser5 Pol II. Experiments were conducted as in A with a specific anti-phospho-Ser5 Pol II antibody. ST was 0.4 (C) Distribution of phospho-Ser2 Pol II. Experiments were conducted as in A with a specific anti-phospho-Ser2 Pol II antibody. ST was 0.1.

