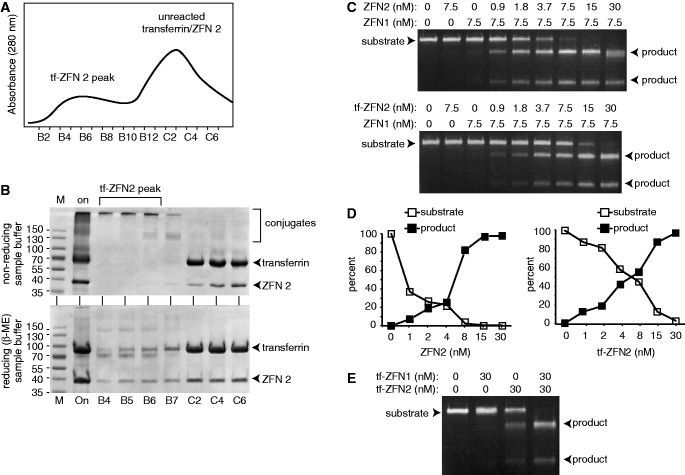
Figure 2.
Production and cleavage activity of transferrin-ZFN conjugates. (A) Purification. S-75 gel filtration chromatography of transferrin and ZFN containing reaction mix. Elution positions of conjugates and reactants are indicated. (B) SDS–PAGE analysis of fractions from panel (A) as indicated. Sample buffer was either non-reducing (top) or reducing (bottom). Reduction of transferrin-ZFN2 (tf-ZFN2) yields free ZFN2, free transferrin and an additional band migrating just ahead of free transferrin, the identity of which is not known. (C) ZFN and tf-ZFN DNA cleavage activity. Figure shows titration of ZFN2 or tf-ZFN2 with ZFN1 held constant. Titrations of ZFN1 and tf-ZFN1 were similar (Supplementary Figure S2). Position of substrate and products are indicated. (D) Quantification of data from panel (C) showing substrate and products as a percentage of total DNA in each lane. (E) Cleavage activity of tf-ZFN1 and tf-ZFN2 in combination.

