
Figure 4.
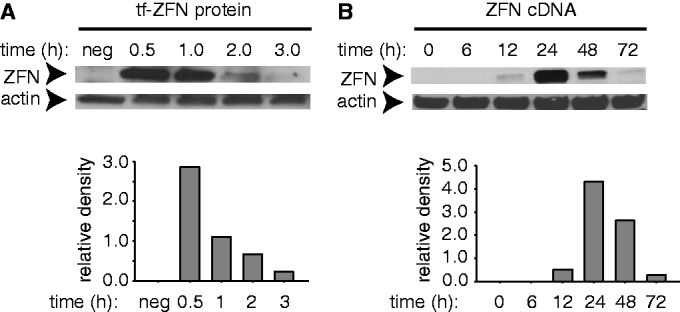
ZFN protein levels in HEK293/A658 cells as measured by immunoblotting. (A) Cells were incubated with 200 nM tf-ZFN1 for 60 min, washed and fresh medium without tf-ZFN1 was added. Cells were incubated for a further 0–3 h as indicated, after which proteins were extracted, resolved by SDS–PAGE and ZFN1 was detected by immunoblotting with anti-FLAG antibody. Lane marked ‘neg’ indicates cells not treated with tf-ZFN1. (B) Same as panel (A), except that cells were transfected with ZFN1/2 cDNA, incubated and analyzed at indicated times. Note difference in time scale in panels (A) and (B).