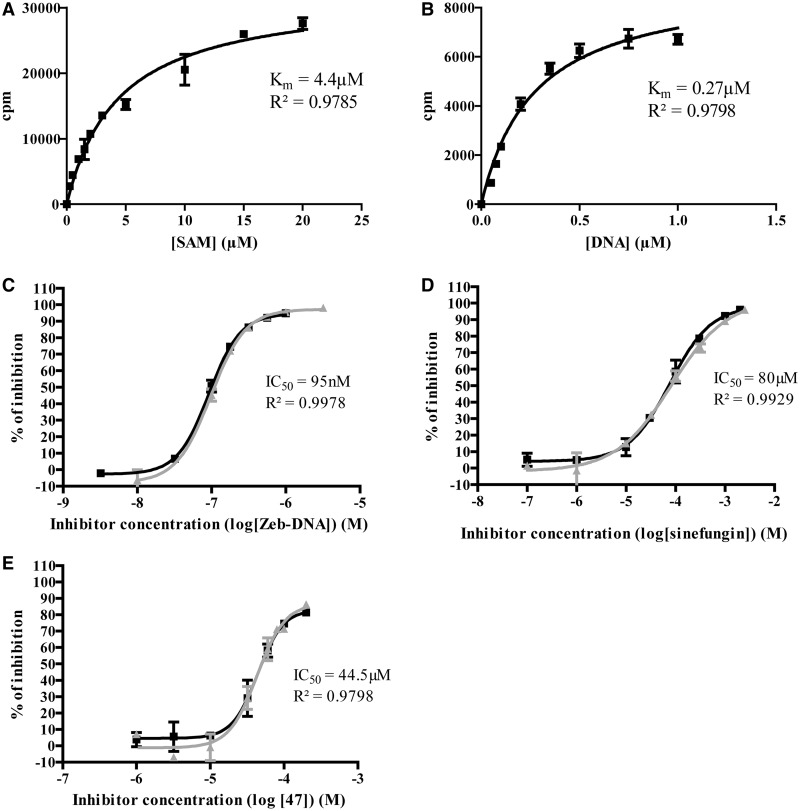
Figure 3.
Characterization of the DNMT1 assay and inhibition studies on reference compounds. (A) Determination of SAM Km at 1.0 µM of hemimethylated Dup_1. (B) Determination of DNA Km at 15 µM of [methyl-3H] SAM. (C) Two independent dose-response curves for zebularine-containing duplex, each in duplicates. (D) Two independent dose-response curves for sinefungin, each in duplicates. (E) Two independent dose-response curves for 47, each in duplicates. Km and coefficient of determination (R2) are displayed. Means of IC50 and coefficient of determination (R2) are displayed.

