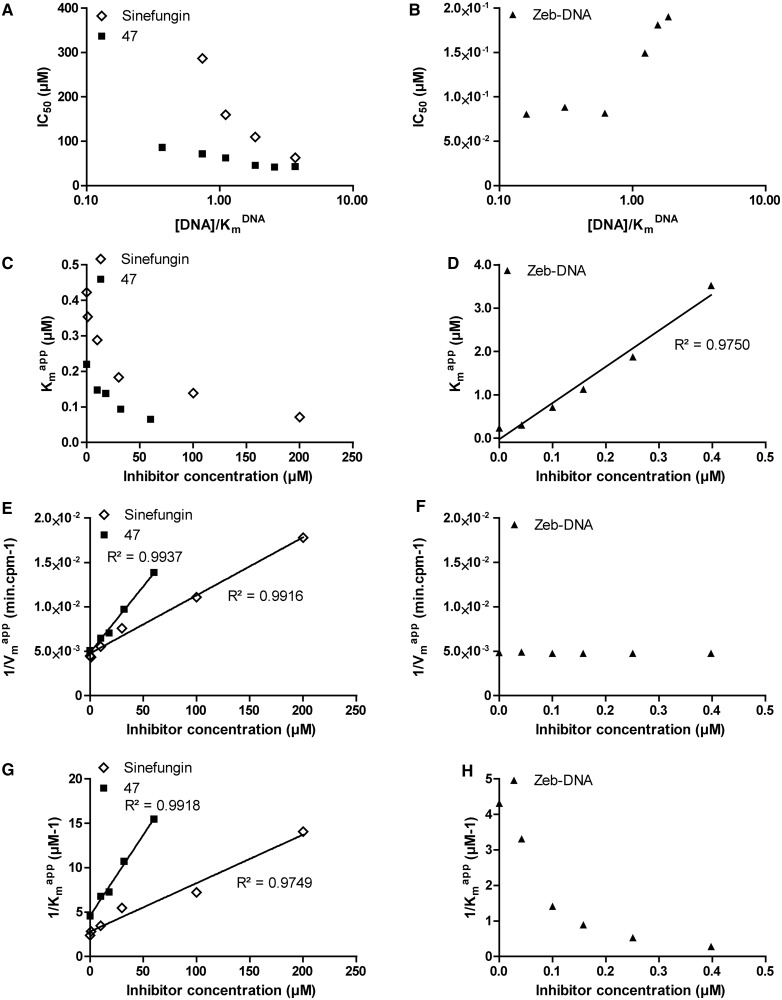
Figure 5.
DNA-competition assays on DNMT1 with sinefungin, zebularine-containing duplex and compound 47. Experiments with sinefungin are represented by open diamonds, zebularine-containing duplex by plain triangles and compound 47 by plain squares. (A and B) IC50 of each molecule as function of [DNA]/ . (C and D)
  as function of [inhibitor]. (E and F) 1/
 as function of [inhibitor]. (G and H) 1/
 as function of [inhibitor]. For each linear regression, if the slope is significantly different from 0, then the regression is represented by a plain line, and the coefficient of determination (R2) is displayed along the corresponding line.

