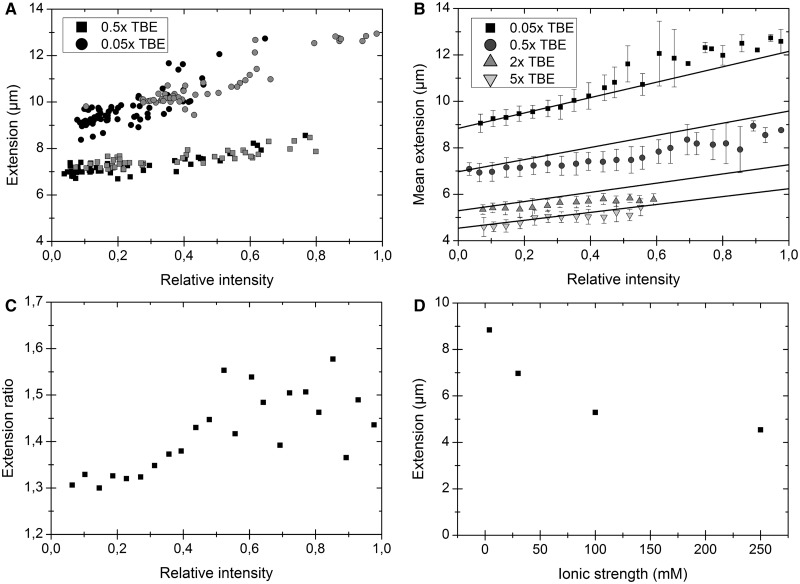
Figure 3.
(A) Extension versus intensity for λ-DNA molecules in 0.05× TBE (circles) and 0.5× TBE (squares) at two different dye:bp ratios; 1:20 (black) and 1:5 (gray). (B) Extension and intensity distributions for ∼2650 λ-DNA molecules (heated and non-heated) at four different ionic strengths. The samples are sorted and binned according to relative intensity in steps of 0.04. The solid lines correspond to the expected increase in extension if the contour length of a fully intercalated DNA (1 dye per 4 bp) is extended with 0.51 nm per YOYO molecule and no other effects are considered (21,22). (C) Extension ratio, i.e. the extension at 0.05× TBE divided by the extension at 0.5× TBE, at different degrees of YOYO binding. (D) The extracted extension (from B) for native DNA at four different ionic strengths, converted from TBE according to ref (14).

