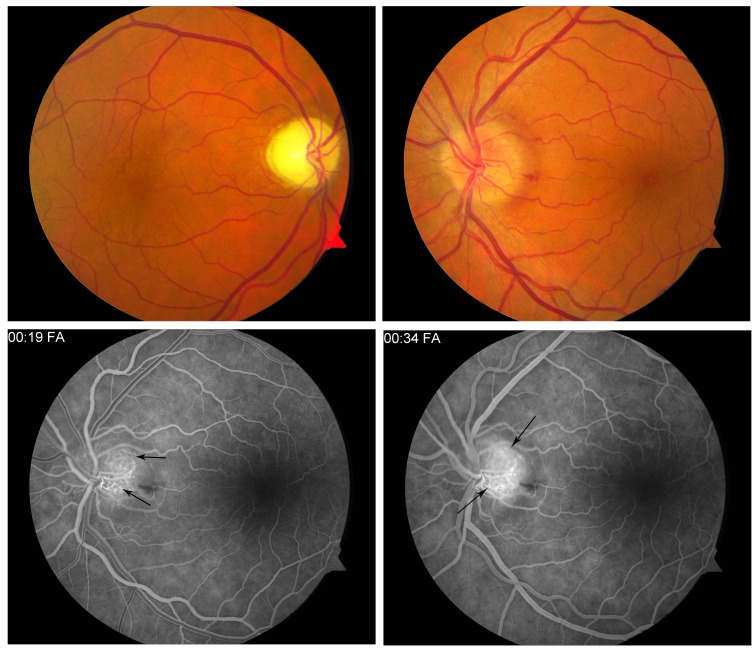
FIGURE 15.
Fluorescein angiography in pre-nonarteritic anterior ischemic optic neuropathy optic disc edema. Upper left, Fundus photograph, right eye, showing optic atrophy from prior NAION. Upper right, Fundus photograph, left eye, showing diffuse optic disc edema. Lower left, Fluorescein angiogram, arteriovenous phase, showing poor filling of optic disc with relatively spared segment temporally (arrows) at 19.0 seconds. Fluorescein angiogram, mid phase, showing continued poor filling of optic disc with progressive hyperfluorescence at relatively spared segment temporally (arrows) at 34.0 seconds.

