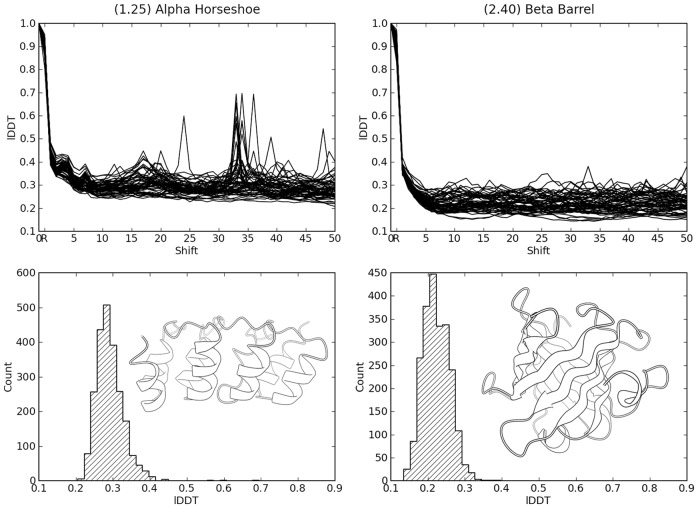
Fig. 4.
Baseline lDDT scores for models with simulated threading errors. lDDT scores of pseudo-models with threading errors for two examples of different CATH Architectures are shown: Alpha Horseshoe (left) and Beta Barrel (right). The lDDT score is plotted as a function of the introduced threading error (top). The histograms (bottom) show the distribution of these ‘baseline’ scores for threading error offset >15 residues for the two architectures. The structure inlays show an example structure of the respective CATH Architecture. Peaks at large off-sets indicate repetitive structural elements with locally correct arrangement

