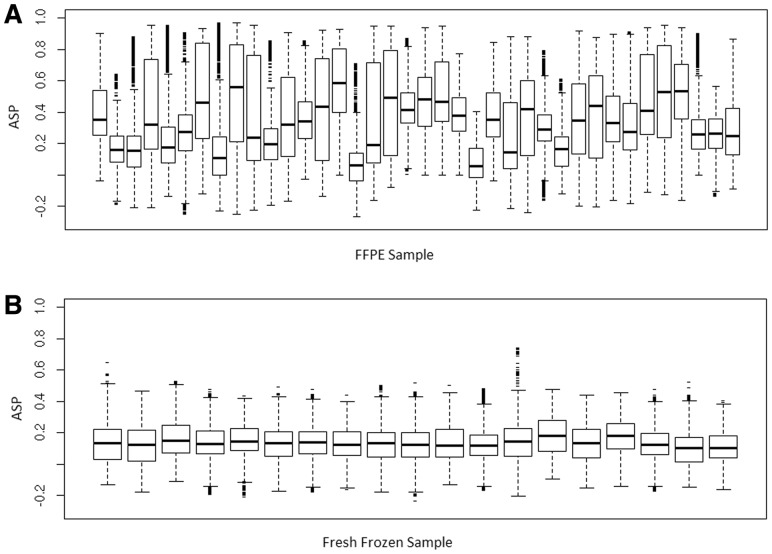
Fig. 2.
Boxplots of ASPs. (A) FFPE samples; (B) Fresh-frozen samples. Data source: GEO accession number GSE17047 (stage II colorectal cancer, tissue samples) for the A and B set. The data are generated using Agilent HD CGH Microarray 2 × 10⁵ k array. The boxplots show the inter-quartile ranges

