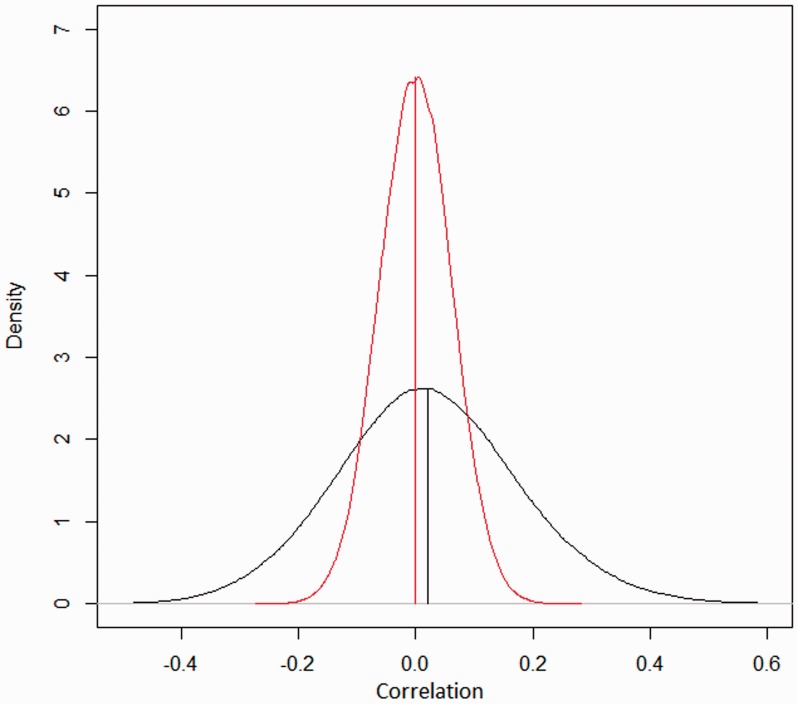
Fig. 5.
Distribution of correlation of measurement errors between neighboring probes. The raw data are from GEO Web site with accession number GSE5173. The dataset is from a healthy population and is used as normal controls for normalization. Array platform: Affymetrix Mapping 250 k Nsp SNP array. Black line denotes the distribution of correlation of errors in the copy number estimates between neighboring SNP sites. The red line shows the distribution of correlation using randomly permuted residuals

