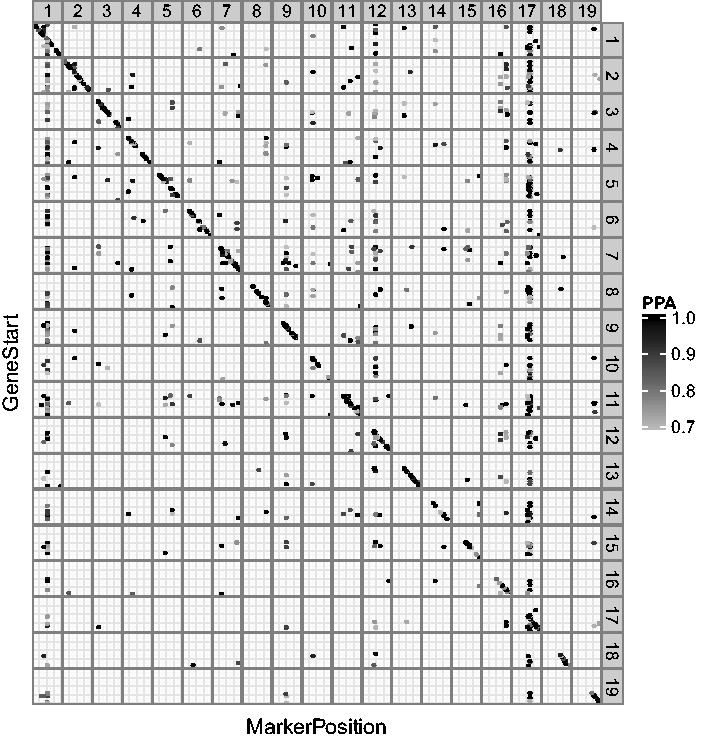
Fig. 1.

Genome-wide distribution of eQTLs found by iBMQ for mice cardiac tissue. The X-axis gives eQTL genomic position; the Y-axis gives the genomic positions of probe sets. Chromosome numbers are given in the gray box strips. cis-QTLs align along the diagonal line. Vertical bands represent groups of transcripts linked to one trans-eQTL. eQTL points are color-coded by PPA value (see PPA color scale). The Supplementary Material presents the code used in the analysis
