
Figure 1. RBM10 RNA binding sites identified by PAR-CLIP.
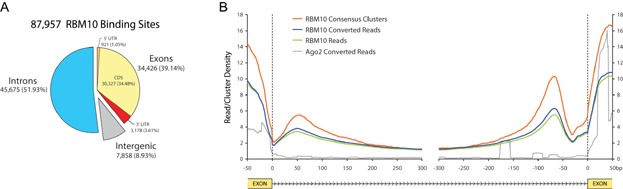
- The genomic distribution of 87,957 RBM10 consensus binding clusters.
- Distribution of RBM10 consensus binding clusters (red line), PAR-CLIP reads (green line) and PAR-CLIP reads containing at least one T to C change (converted reads, blue line) along exon–intron and intron–exon boundaries. The density of RBM10 converted PAR-CLIP reads in the vicinity of intronic splice sites were significantly higher than that of Ago2 converted PAR-CLIP reads (grey line).