
Figure 5. Correlation between RBM10 binding, exon splicing changes, intron splicing changes and splicing site strengths.
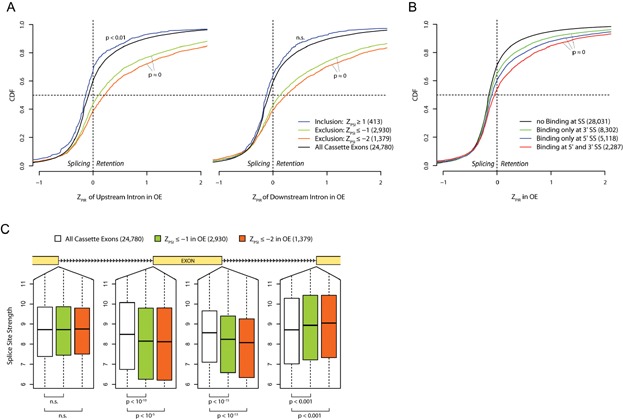
- Cumulative distribution functions (CDF) of splicing change of introns (ZPIR, percentage intron retention) upstream (left) or downstream (right) to the cassette exons that were differentially spliced upon RBM10 OE. Exon exclusion upon RBM10 OE (orange: ZPSI ≤−2; green: ZPSI ≤−1, PSI: percentage splicing in) is associated with higher retention of both flanking introns than background (black) and exon inclusion (blue: ZPSI ≥1). The numbers of exons were indicated in parenthesis.
- Cumulative distribution functions of ZPIR for different groups of introns with or without RBM10 binding at the 5′ and/or 3′ splice sites. The numbers of introns within different groups were printed in parenthesis.
- Box plots of the strengths of splicing splice sites at upstream and downstream introns flanking all cassette exons (white) or those with higher exclusion after upon RBM10 OE (orange: ZPSI ≤−2; green: ZPSI ≤−1).