Figure 3.

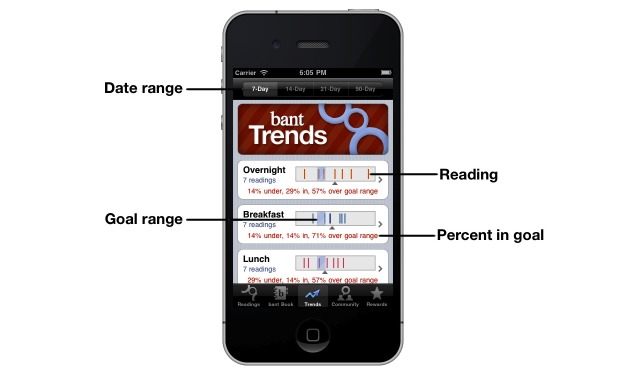
Trends allows at-a-glance review of readings over 7-day, 14-day, 21-day, and 90-day periods. The percentages of readings under, within, and above target range are noted for quick review.

Trends allows at-a-glance review of readings over 7-day, 14-day, 21-day, and 90-day periods. The percentages of readings under, within, and above target range are noted for quick review.