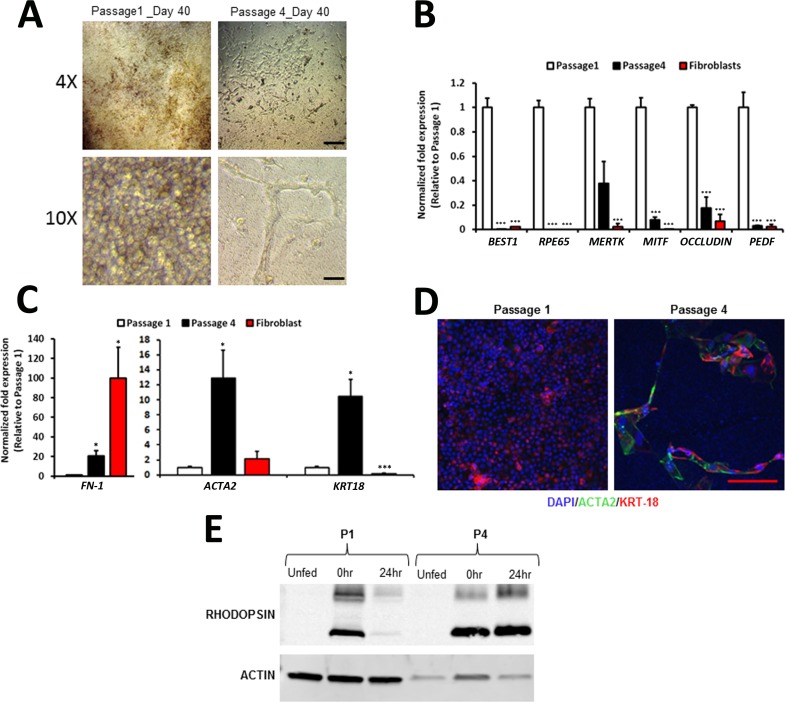
Figure 7.
Comparison of morphological, gene expression, and functional characteristics of hiPSC-RPE at passage 1 and passage 4. (A) Representative low- (×4) and high- (×10) magnification light microscopic images of day 40 P1 and P4 hiPSC-RPE grown on transwell inserts. (B) Relative expression of selected RPE genes in P1 and P4 hiPSC-RPE at day 40. (C) Relative gene expression of mesenchymal (FN1, ACTA2) and epithelial (KRT18) markers in human fibroblasts and P1 and P4 hiPSC-RPE cells. (D) Confocal images showing expression and localization of ACTA2 and KRT18 in P1 and P4 hiPSC-RPE cells. (E) Western blot analysis showing the amount of rhodopsin monomer (lower band) and dimer (upper band) present in P1 and P4 hiPSC-RPE at 0 and 24 hours after unlabeled POS feeding. Scale bar: ×4 images = 250 μm; ×10 images = 50 μm. *P < 0.05; ***P < 0.0005.

