
Figure 2.
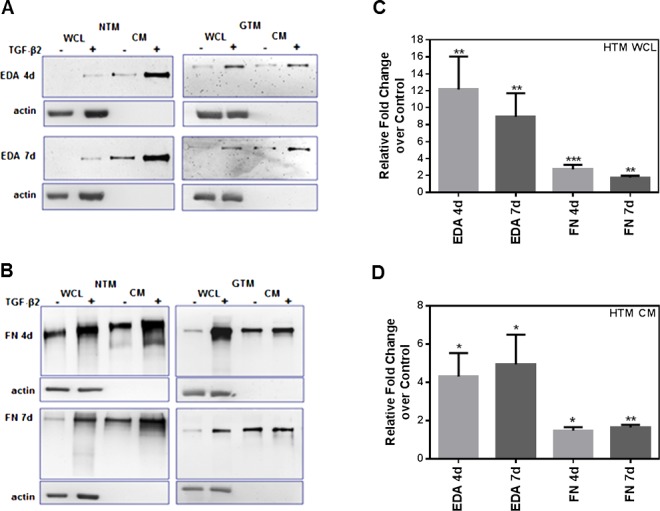
Induction of EDA isoform and total FN protein expression in human TM cells after TGF-β2 treatment. Three NTM and three GTM cell strains (HTM cells, n = 6) were treated for 4 and 7 days with or without TGF-β2 (5 ng/mL). Densitometry analysis of Western immunoblots was used to determine changes in EDA isoform and total FN protein content after treatment. Representative Western immunoblot images of EDA isoform (A) and total FN (B) in NTM and GTM cell strains showed induction of both FN isoforms in WCL and in CM samples after 4 and 7 days of TGF-β2 treatment. Densitometry analysis using ImageJ software of each FN immunoblot image showed a significant increase of EDA isoform, and total FN protein WCL (C) and CM (D) levels after TGF-β2 treatment when compared to untreated HTM cells. The WCL values were normalized to β-actin loading controls. Relative fold changes compared to untreated controls for WCL and CM values are represented as the mean ± SEM. Statistical significance was calculated using 1-way ANOVA (n = 6; *P < 0.05, **P < 0.01, ***P < 0.001).