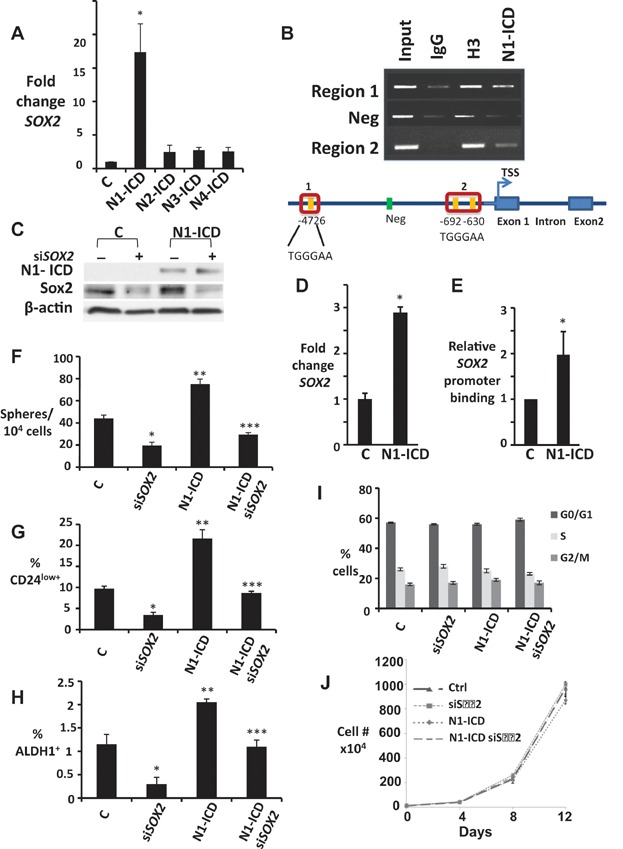
A.
SOX2 qPCR in HC-11 cells ± N1-ICD, N2-ICD, N3-ICD or N4-ICD overexpression, graphed as fold change versus parental controls, normalized to HPRT. *p = 0.018.
B. ChIP shows N1-ICD and control histone H3 binding to indicated CSL binding sites in murine SOX2 promoter in HC-11 (top). Schematic of murine SOX2 promoter (bottom).
C–E. Controls or N1-ICD overexpressing MDA-MB-231 cells were assayed for N1-ICD and Sox2 by Western (C) SOX2 expression by qPCR (*p = 0.006) (D) and relative binding of N1-ICD to SOX2 promoter (E) and means graphed ± SEM.
F–H. Effects of siSOX2 were assayed in MDA-MB-231 ± N1-ICD overexpression on spheres formed/10,000 plated cells (F), % of CD44+CD24low+ (G) and % ALDH1+ cells (H). Graphs show mean ± SEM; For (F), ***p = 0.019, **p = 0.032 and *p = 0.026; for (G), ***p = 0.0049, **p = 0.0048 and *p = 0.0007 and for (H), ***p = 0.04, **p = 0.03 and *p = 0.01 (Student's t-test compared to control, C).
I. Cell cycle profiles of siSOX2 in MDA-MB-231 ± N1-ICD overexpression.
J. Proliferation curves are unchanged by siSOX2 in MDA-MB-231 cells ± N1-ICD overexpression.