Figure 3.

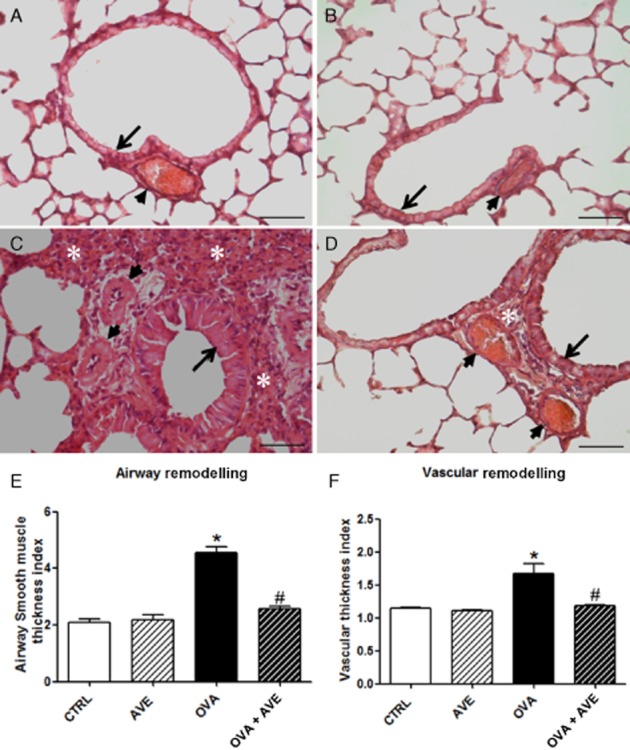
Representative histological images of airways (arrow) and pulmonary vessels (arrowhead) from CTRL (A), AVE (B), OVA (C) and OVA + AVE (D) groups (n = 5 each). A and B show lung parenchyma with normal aspect of the airway and vessels. C shows marked interalveolar interstitial thickening resulting mainly from the accumulation of inflammatory cells (white asterisk), bronchiolar wall thickening by hypertrophy and hyperplasia of bronchial epithelium and SMC layer, reduction in the alveolar lumen and vascular remodelling with increased size and number of vessels within the airway wall contributing to thickening of wall. Image D shows reduced inflammation in the interalveolar space with normal appearance of alveolar lumen and bronchioles of the lung parenchyma in OVA + AVE mice. In addition, reduced inflammation in the interalveolar space with normal appearance of alveolar lumen and bronchioles. (E) Thickness index of airway smooth muscle and bronchial epithelial layer was calculated by counting the number of points hitting muscle areas divided by the number of intercepts crossing the epithelial basement membrane. (F) Morphometric analysis of vascular thickness index calculated by the EP and IP ratio, EP/IP ratio. *P < 0.05 significantly different from CTRL and #P < 0.05 significantly different from OVA; one-way anova followed by Newman–Keuls post test. Bar = 20 μm.
