Figure 2.

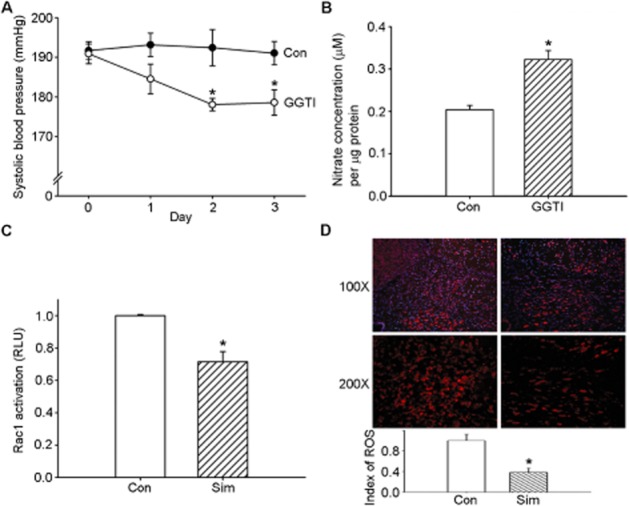
Geranylgeranyl pyrophosphate may be involved in the simvastatin-mediated depressor response. (A) Time course tracing of systolic blood pressure (SBP) after i.c.v. administration of a geranylgeranyl pyrophosphate inhibitor, GGTI, for 3 days. SBP was measured on days 0, 1, 2 and 3 after treatment. (B) Levels ofNO in samples from the nucleus tractus solitarii (NTS) after administration of GGTI. The bar graph shows the NO concentration. (C) Bar graph showing the activation ratio of Rac1 after treatment with simvastatin. Note the significant decrease in Rac1 activation after administration of simvastatin. (D) Representative red fluorescence images depicting reactive oxygen species (ROS)-producing cells in the NTS after the administration of simvastatin. The nuclei in the NTS were counterstained with DAPI and exhibit blue fluorescence. The images were photographed at 100 and 200 × magnification. Bar graph presentation of the ROS index in the NTS of the simvastatin-treated and control groups. The ROS index is the relative mean intensity of fluorescence of DHE. Values are shown as the mean ± SEM, n = 6. *P < 0.05 versus control group.
