
Figure 5.
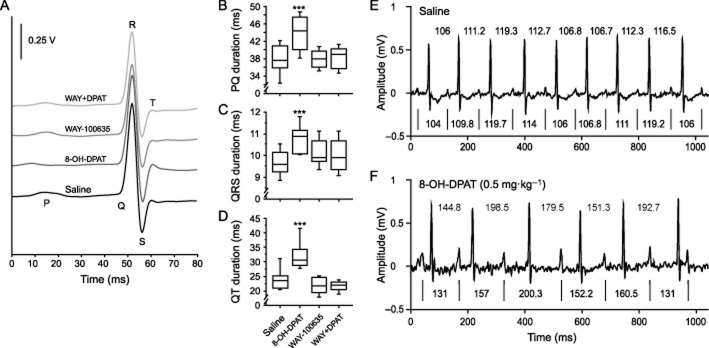
ECG subinterval analyses and RR versus PP intervals of successive ECG signals. ECG waveforms were synchronized on the R peak (A). Durations of PQ (B), QRS (C) and QT (D) intervals as a function of drug treatment are presented as box plots. Examples of the temporal relation of RR versus PP intervals of successive ECG signals in two mice after administration of saline (E) or 8-OH-DPAT (DPAT; F). RR intervals are indicated above the two ECG traces, whereas PP intervals are provided below the two ECG traces with the vertical lines (|) indicating P peaks. All intervals are given in ms. Drugs were injected subcutaneously at the following doses: 8-OH-DPAT (0.5 mg·kg−1), WAY-100635 (WAY: 0.03 mg·kg−1); n = 13 per group; ***P < 0.001 versus saline control.