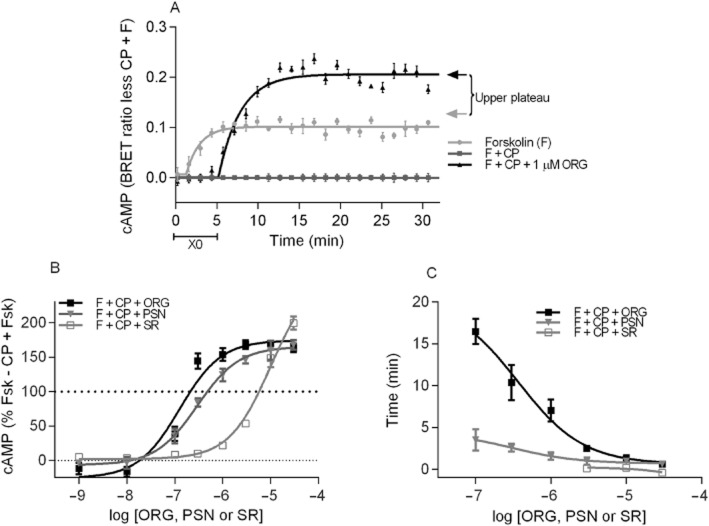
Figure 4.
(A) An individual representative real-time cAMP BRET assay for HEK 3HA-hCB1 cells normalized such that F + CP equalled zero at each point, while forskolin alone equalled 100%. This normalization facilitated fitting of a ‘plateau then exponential association’ curve that allowed measurement of the ‘X0’ plateau, indicating the length of time the allosteric modulator trace tracked with F + CP prior to the initiation of antagonism, while the top plateau of the exponential association allowed measurement of the maximum cAMP level reached (arrows). (B) Summary data for the maximum cAMP level reached (as measured by the top plateau of ‘plateau then exponential association curves’) for HEK 3HA-hCB1 stimulated with 10 μM forskolin and 1 μM CP55,940 in the presence of 1 nM – 30 μM ORG27569 (ORG), PSNCBAM-1 (PSN) or SR141716A (SR). (C) Summary data for the time prior to detection of inhibition (as measured by the ‘X0’ time of ‘plateau then exponential association curves’) of HEK 3HA-hCB1 signalling with 10 μM forskolin and 1 μM CP55,940 (F + CP) in the presence of 0.1–30 μM ORG27569 (ORG), PSNCBAM-1 (PSN) or SR141716A (SR). Only concentrations of allosteric modulator that ultimately produced maximum cAMP levels statistically different from F + CP are represented. For (B) and (C), raw data were normalized to F + CP (0%) and forskolin alone (100%), and plotted as the mean ± SEM of four to five independent experiments.

