
Figure 8.
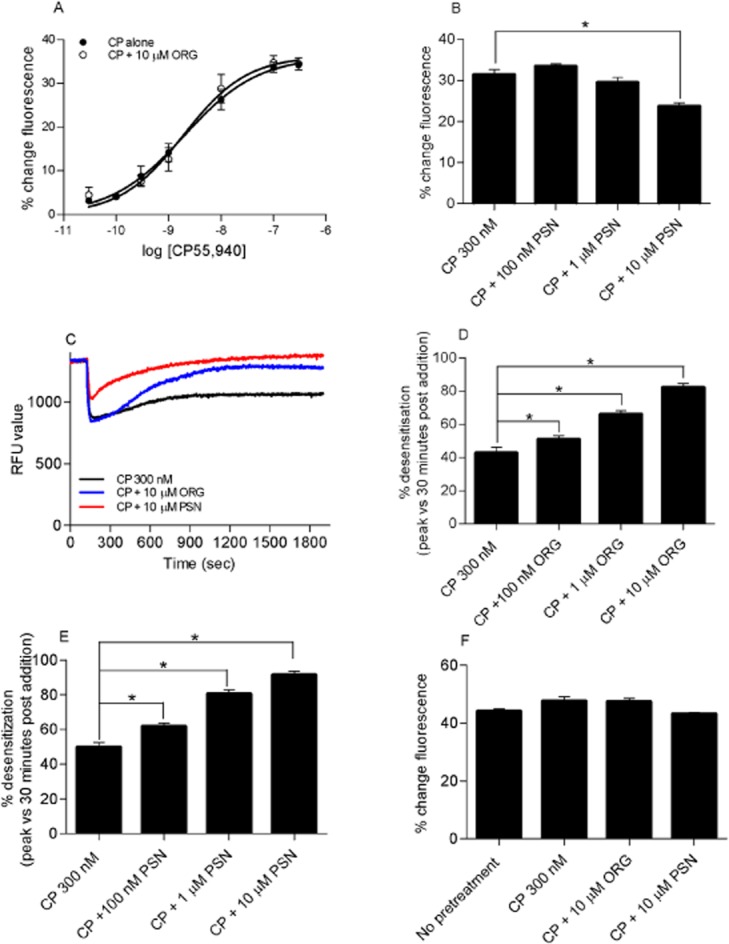
(A) CP55,940 concentration–response curve of hyperpolarization of AtT-20 HA-rCB1 cells in the presence of 10 μM ORG27569. Cells were pre-incubated with either vehicle or 10 μM of ORG27569 (ORG) for 5 min prior to subsequent application of CP55,940 in the continued presence of either vehicle or ORG. In this assay, change in the observed fluorescence represents a hyperpolarization of the cell (n = 5). (B) Hyperpolarization of AtT-20 HA-rCB1 cells stimulated with 300 nM of CP55,940 (CP) in the presence of 10 μM, 1 μM and 100 nM PSNCBAM-1 (PSN). In this assay, change in the observed fluorescence represents a hyperpolarization of the cell (n = 6). (C) Desensitization of AtT-20 HA-rCB1 cells after stimulation with 300 nM of CP in the presence or 10 μM ORG or PSN. This figure shows a representative trace for 300 nM CP, 300 nM CP and 10 μM ORG and 300 nM CP and 10 μM PSN. Drug treatments were added 2 min into the experiment. (D) Desensitization of AtT-20 HA-rCB1 cells after stimulation with CP in the presence of 10 μM, 1 μM and 100 nM ORG. This graph shows the percentage desensitization comparing peak fluorescence after the addition of drug and 30 min post-drug addition (n = 6). (E) Desensitization of AtT-20 HA-rCB1 cells after stimulation with CP in the presence of 10 μM, 1 μM and 100 nM PSN. This graph shows the percentage desensitization comparing peak fluorescence after the addition of drug and 30 min post-drug addition (n = 6). (F) Somatostatin challenge of AtT-20 HA-rCB1 cells after no pretreatment, pretreatment in the presence of CP or CP with either 10 μM ORG or PSN. After 30 min pre-incubation, cells were stimulated with 100 nM somatostatin and the hyperpolarization or % change in fluorescence was measured (n = 5). * indicates a P-value of 0.01–0.05.