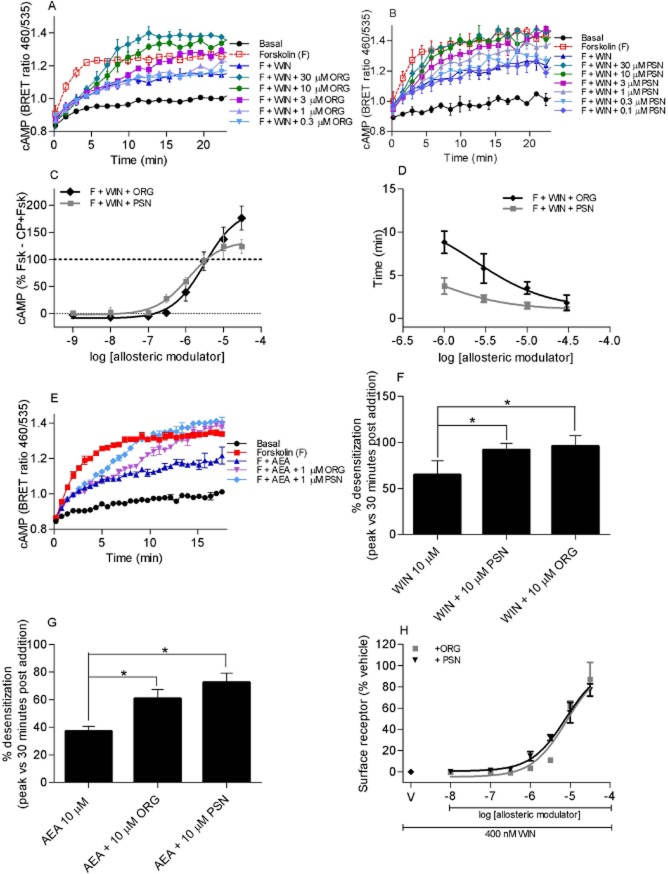
Figure 10.
A representative cAMP BRET assay for HEK 3HA-hCB1 cells with 10 μM forskolin (F) and WIN55,212-2 (1 μM) in the presence of (A) 0.1–10 μM ORG27569 (ORG) and (B) 0.1–10 μM PSNCBAM-1 (PSN). Emission data for RLuc and YFP were collected over time and values plotted as raw ratio (± SEM) of emissions 460/535 over time (min). (C) Summary data for the maximum cAMP level reached (as measured by the top plateau of ‘plateau then exponential association curves’) for hCB1 stimulated with 10 μM forskolin plus 1 μM WIN55,212-2 (F + WIN) and 1 nM–30 μM ORG27569 (ORG) or PSNCBAM-1 (PSN). Raw data were normalized to F + WIN (0%) and forskolin alone (100%), and plotted as the mean ± SEM of three independent experiments. (D) Summary data for the time prior to detection of inhibition (as measured by the ‘X0’ time of ‘plateau then exponential association curves’) of hCB1 signalling with 10 μM forskolin plus 1 μM WIN55,212-2 (F + WIN) and 0.1 μM – 30 μM ORG or PSN. Only concentrations of allosteric modulator that ultimately produced maximum cAMP levels statistically different from F + WIN are represented. Raw data were normalized to forskolin plus WIN55,212-2 (0%) and forskolin alone (100%), and plotted as the mean ± SEM of three independent experiments. (E) An individual representative real-time cAMP BRET assay for hCB1, anandamide (AEA) and allosteric modulators. HEK 3HA-hCB1 cells were stimulated with vehicle, 5 μM forskolin (F), 10 μM AEA as well as either 1 μM of ORG or PSN. Values plotted as raw ratio (SEM) of emissions 460/535 over time (min). (F) Desensitization of AtT-20 HA-rCB1 cells after stimulation with 10 μM WIN in the presence of 10 μM ORG or 10 μM PSN. This graph shows the percentage desensitization comparing peak fluorescence after the addition of drug and 30 min post-drug addition (n = 5). (G) Desensitization of AtT-20 HA-rCB1 cells after stimulation with AEA in the presence of 10 μM ORG or 10 μM PSN. This graph shows percentage desensitization comparing peak fluorescence after the addition of drug and 30 min post-drug addition (n = 5). (H) Concentration-dependent inhibition of 400 nM WIN55,212-2 (WIN)-induced hCB1 internalization with allosteric modulators ORG27569 (ORG) and PSNCBAM-1 (PSN). A representative graph that depicts the fluorescently tagged HA-hCB1 surface receptor for each concentration of allosteric modulator normalized to surface receptor in vehicle-treated cells. WIN with allosteric modulator vehicle is shown as V on the graph. * indicates a P-value of 0.01–0.05.

