
Figure 3.
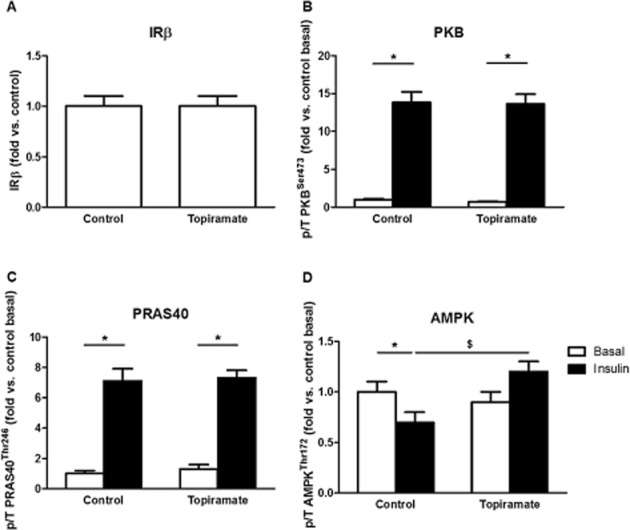
Expression of IRβ (A) and phosphorylation state of PKB (B), PRAS40 (C) and AMPK (D) in basal state (black bars) or hyperinsulinaemic state (white bars) in muscle of mice-treated with vehicle or topiramate. The Western blot data were expressed as fold change compared to vehicle at basal condition. Data are represented as means ± SEM for n = 8–10, *P < 0.05 insulin versus basal. $P < 0.05 topiramate versus vehicle.