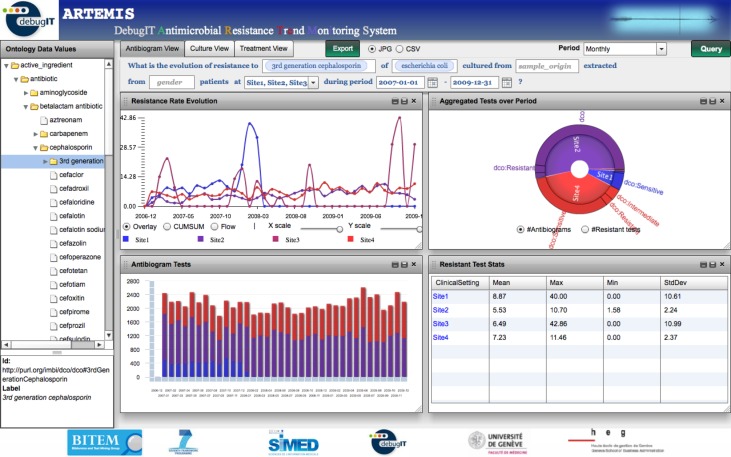
Figure 3.
Antimicrobial Resistance Trend Monitoring System (ARTEMIS) interface. The menu on the left displays the interface ontology concepts, which are used to fill in the template parameters. Each of the view tabs represents a different query template. The data visualization interface displays several graphical representations to provide a comprehensive view of the data.

