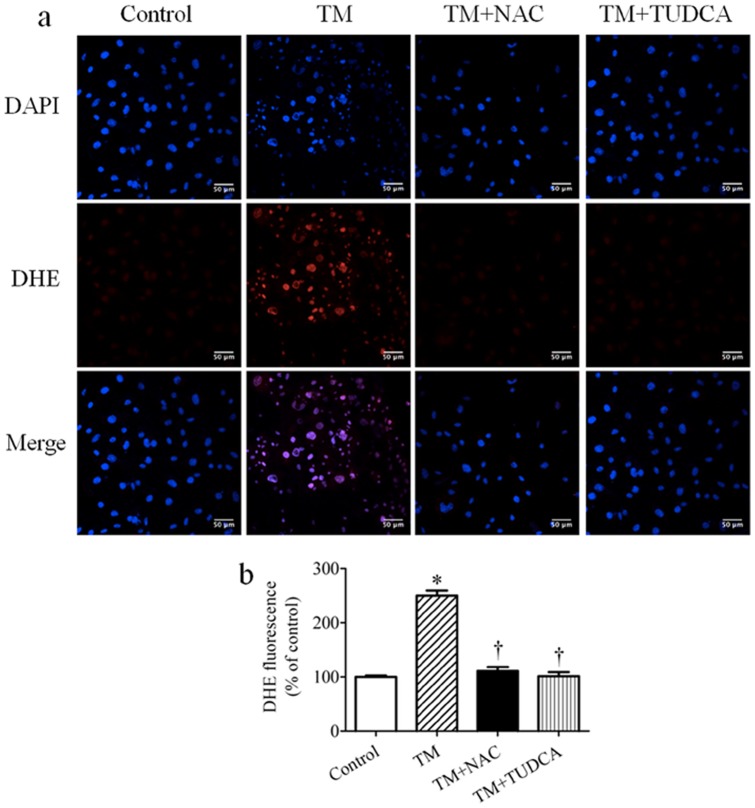
Figure 6. The effect of NAC and TUDCA on tunicamycin (TM)-induced ROS production in cultured myotubes.
Representative confocal microscopy pictures (a) and spectrophotometric quantification (n = 6) (b) of intracellular ROS production in C2C12 myotubes treated with tunicamycin in presence of 10 mmol/l NAC or 1 mmol/l TUDCA for 24 hours. ROS detection dye DHE is shown as red, the nucleus is stained with DAPI (blue), with purple suggests colocalization. Scale bars, 50 µm.

