
Figure 3. Radial gradients of signal magnification produce sloping solution plateaus.
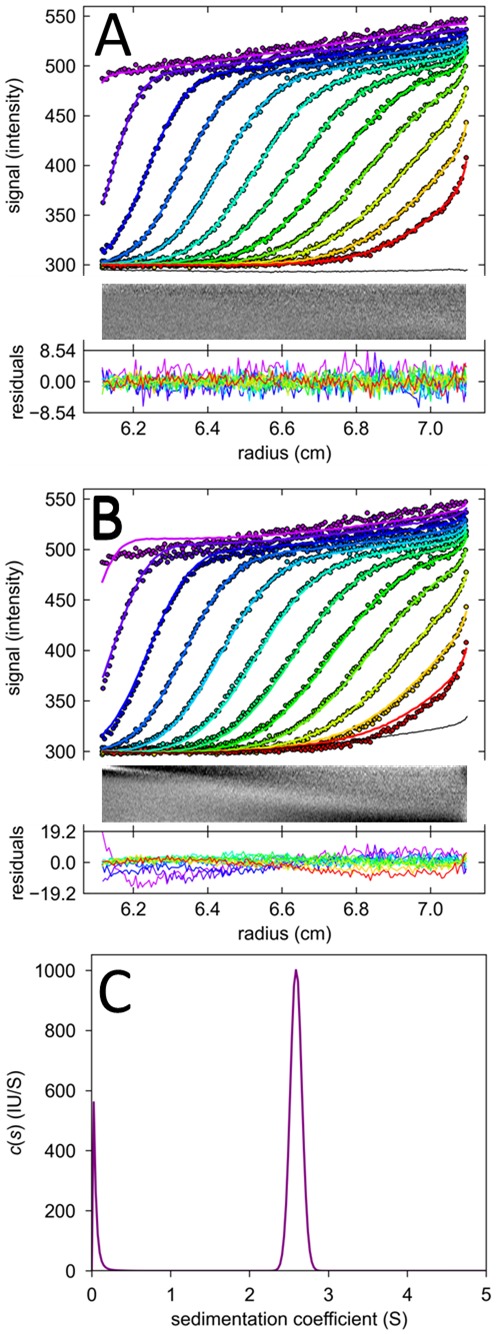
Shown are FDS-SV data of 135 nM EGFP acquired at a focal depth of 989 μm. (A) Experimental scans (symbols) and best-fit model (solid lines) using a model incorporating TI noise and a radial magnification gradient with best-fit value of dε/dr = 0.28, leading to a best-fit rmsd of 1.79 counts. The TI noise is shown as black line. The sedimentation model is c(s), resulting in a single peak at 2.59 S with frictional ratio 1.39, corresponding to an apparent molecular weight of 31.9 kDa. Residuals are shown in the lower panels, as residuals bitmap and overlay plot. (B) Analogous representation of the same data modeled without radial magnification gradient, which leads to a curved TI profile partially compensating for the sloping plateau. The rmsd of the best fit is 3.42 counts. The peak s-value of c(s) in this fit is 2.65 S, with a frictional ratio of 1.67 corresponding to an apparent molecular weight of 43.3 kDa. (C) Sedimentation coefficient distribution c(s) corresponding to the correct model show in Panel A.