
Figure 5. Illustration of the temporal magnification changes.
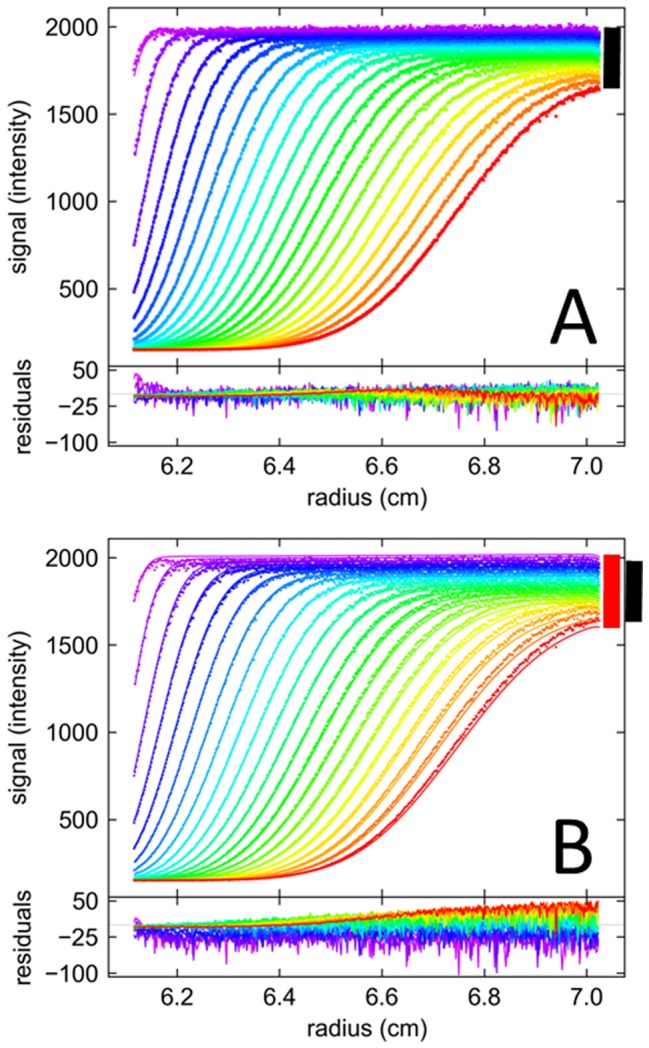
FDS-SV data of EGFP at a concentration of 664 nM were acquired at a focal point 3955 μm. (A) The data (crosses) were fitted with a single species model (lines) incorporating a radial gradient of signal magnification dε/dr with a best-fit value of 0.0079 cm−1, and a temporal drift dε/dt of 0.0127 h−1. (B) Based on the best-fit model of Panel A, boundary profiles were calculated for the same data with identical model parameters but eliminating the temporal drift, setting dε/dt = 0. No further fit was done in Panel B, except an adjustment of the macromolecular concentration parameter. In order to highlight the difference in the boundary shapes, the black bar reflects the measured radial dilution (A), whereas the red bar reflects the radial dilution in the absence of signal drifts based purely on geometry of sedimentation (B). The residuals reflect the difference between the data and the model without temporal drift correction.