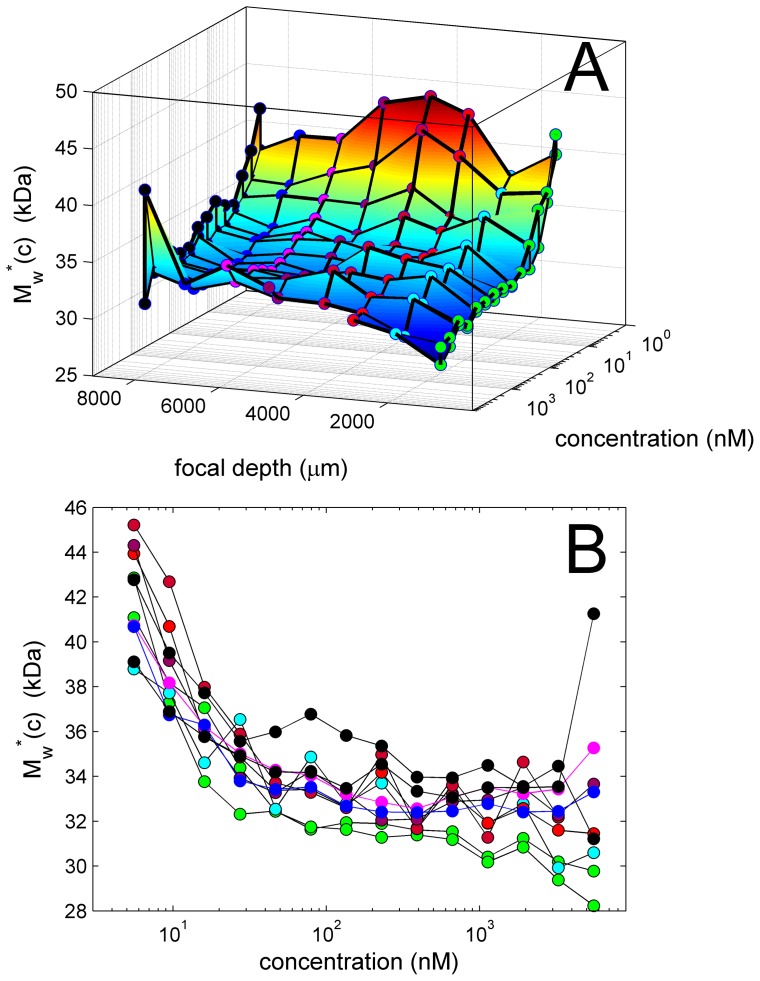
Figure 11. Apparent molecular weights as a function of EGFP concentration and focal depth.
Mw*-values are based on integration of c(s) and each represent an average of values at different gain setting. A surface and contour plot (A) and overlay (B) are shown for the same data. For clarity, experimental series with different focal depth are highlighted with markers of different color: 989 µm in green (two sets), 2055 µm in light blue, 3055 µm and 3095 µm in red, and 5055 µm in purple, 6055 µm in magenta, 7055 µm in dark blue, and 8000 µm in black (two sets).

