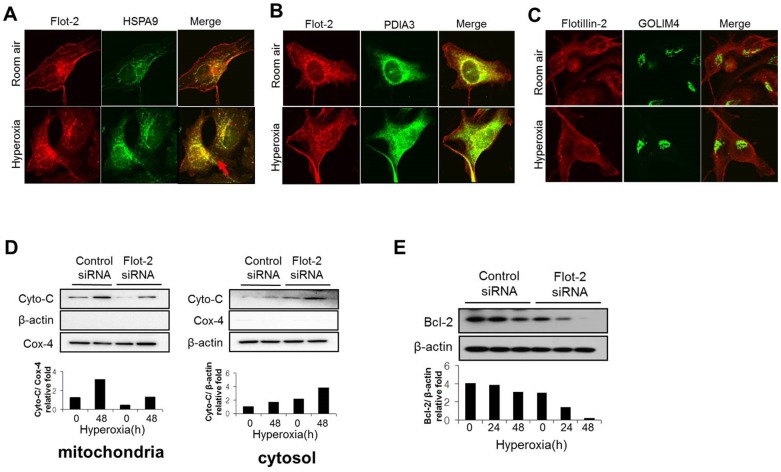
Figure 4. Deletion of Flot-2 enhanced mitochondria mediated intrinsic apoptosis.
(A): Intracellular location of Flot-2, in the presence and absence of hyperoxia. Beas 2B cells were exposed to room air or hyperoxia, as described previously. After 4h, cells were stained with anti-Flot-2 and anti-HSPA9 (markers of Mitochondria). Next, the cells were observed under confocal microscopy. Red: Flot-2; Green: HSPA9; Yellow: merge. (B): Beas 2B cells were exposed to room air or hyperoxia, as described previously. After 4h, cells were stained with anti-Flot-2, anti-PDIA3 (markers of ER). Next cells were observed under confocal microscopy. Red: Flot-2; Green: PDIA3 for ER, Yellow: merge (C): Beas 2B cells were exposed to room air or hyperoxia, as described previously. After 4h, cells were stained with anti-Flot-2, anti- GOLIM4 (markers of Golgi) and then cells were observed under confocal microscopy. Red: Flot-2; Green: GOLIM4 for Golgi; Yellow: merge (D) Silencing of Flot-2 regulated cytochrome C (Cyto-C) release from mitochondria to cytosol, after hyperoxia. Beas-2B cells were transfected with Flot-2 siRNA or control siRNA. After hyperoxia or room air (48h), mitochondria and cytosol were isolated from these cells using Mitochondria Isolation Kit, as described in material and methods. Equal amount of mitochondria and cytosol were used to perform Western Blot. Left panel: Cyto-C detected in mitochondria; Cox-4 was used as the mitochondria marker and β-actin as the cytosol marker. Right panel: Cyto-C detected in cytosol. (E) Silencing of Flot-2 down-regulated the expression of Bcl-2. Beas 2B cells were transfected with Flot-2 siRNA or control siRNA. Cells were next exposed to hyperoxia or room air. After the indicated time courses, the whole cell lysate was subjected to Western Blot Analysis using anti-Bcl-2. All figures above represented three independent experiments with similar results.

