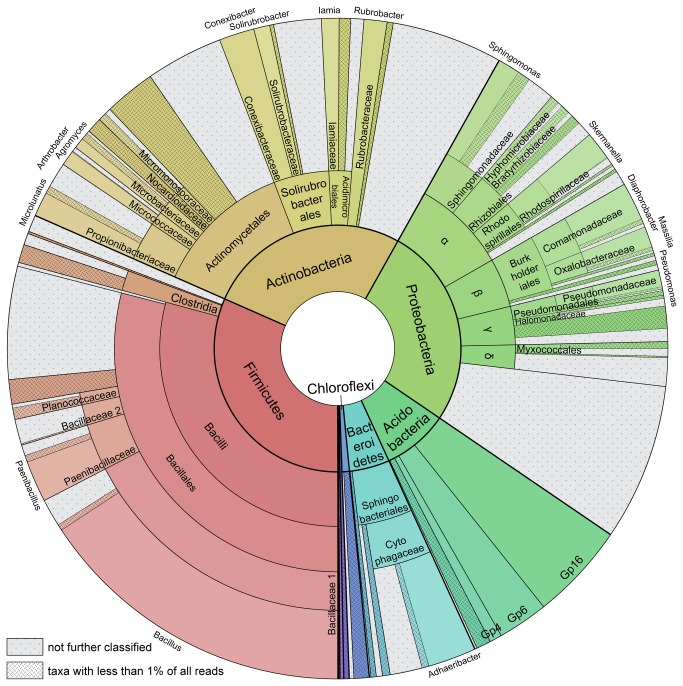
Figure 1. Taxonomic distribution of the microbiota according to read classification in both chambers.
Classification is according to the RDP classifier with 0.8 bootstrap cutoff. Reads unassignable at the generic level were included as far as possible in the hierarchical lineage and are displayed with dots. Taxonomic groups with less than 1% share of total number of reads were combined for the sake of clarity and are illustrated by crossed stripes.

