
Fig. 6.
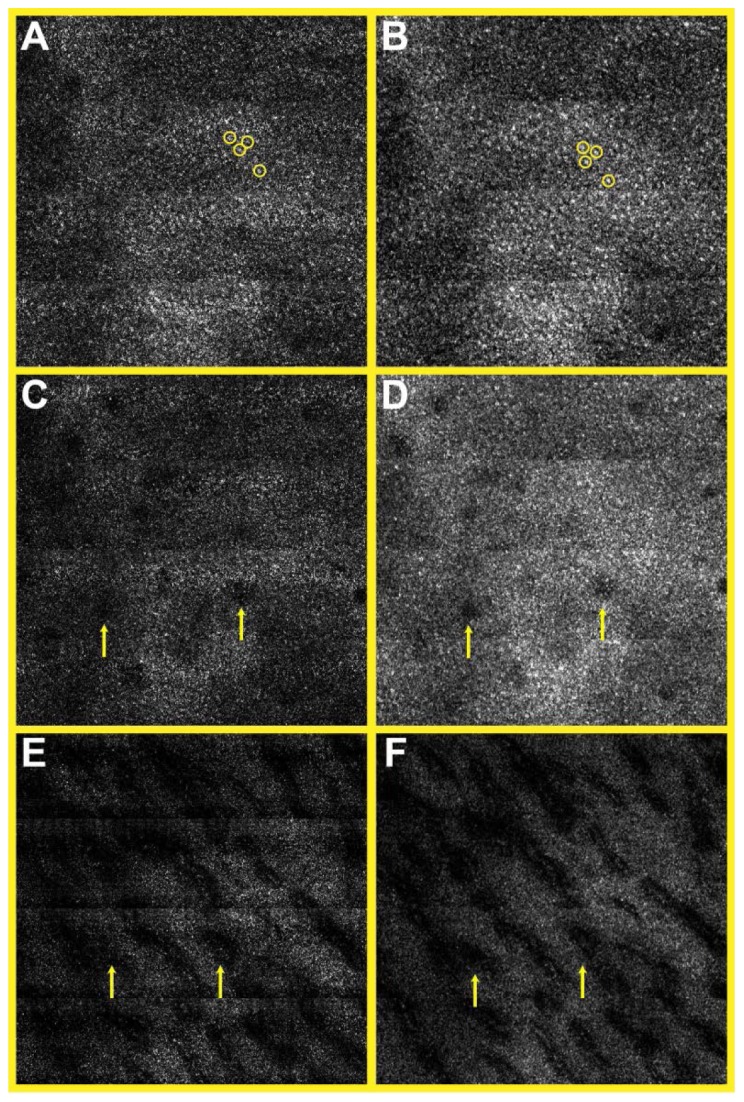
SECM images of swine esophageal tissue ex vivo taken from the imaging depths of 130 µm (A, B), 160 µm (C, D), and 260 µm (E,F). A, C, E – single-mode images; and B, D, F – multi-mode images. circles – basal cell nuclei; and arrows – papillae. Size of each image = 700 µm × 700 µm.