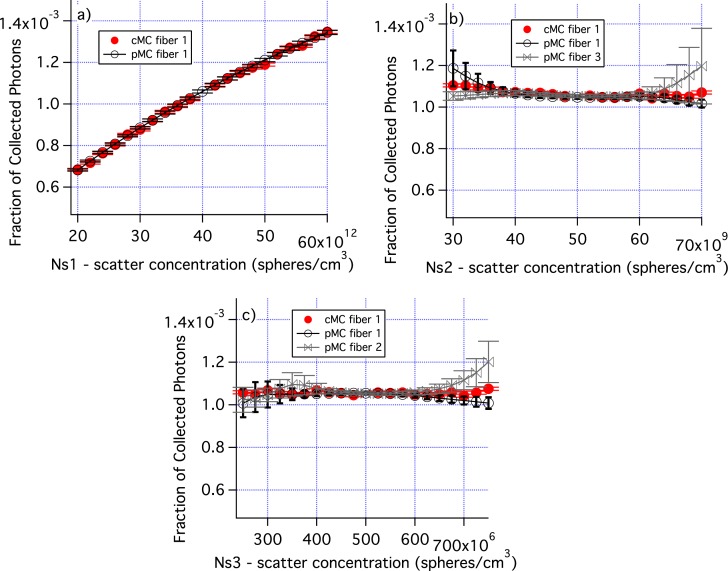
Fig. 8.
The number density of each of the distributions in Table 1 is varied. a) Ns for the smallest size distribution is varied. b) Ns for the middle size distribution is varied. c) Ns for the large size distribution is varied. Errors are standard error of the mean. Only cMC results for fiber 1 are shown for clarity. Similarly, only pMC results for one or two fibers are shown.

