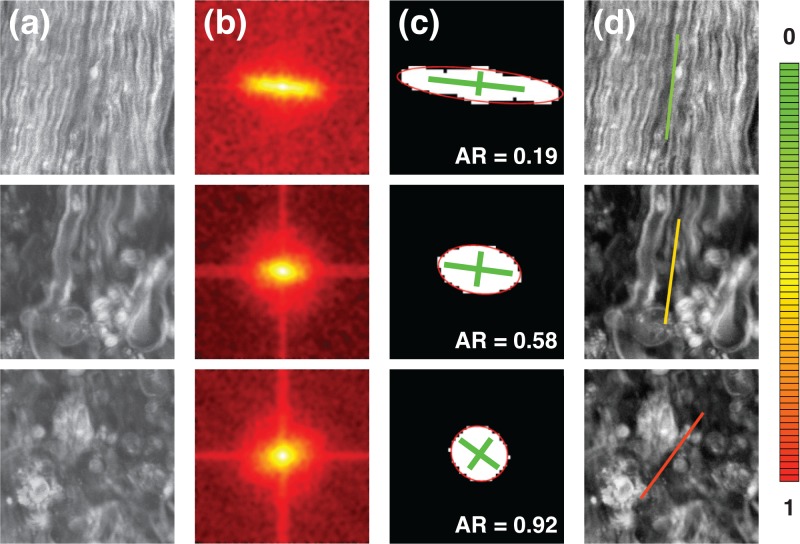
Fig. 2.
(a) Three different CARS images of mouse spinal cord surface in the longitudinal orientation. From top to bottom, the tissue becomes progressively afflicted by EAE lesions. (b) Processed 2D-FT of the domains. (c) Segmented objects with superposed equivalent ellipses and main axes. (d) Average fiber orientation overlaid on the images with AR color-coded (AR color code shown right).

